Showing posts with label anchor chart. Show all posts

Saturday, March 26, 2011

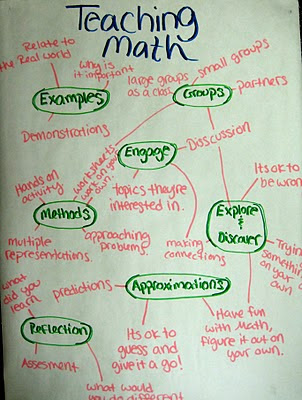
Learning Math Anchor Charts

Anchor charts are a way to summarize learning that you wish to preserve, build from, or be able to reference.  While they started out in my classroom as lists or concept maps, students building from previous students' work have started edging into metaphor territory as well.  I had the camera with me to capture the charts, and the students wanted to present them, so I taped it.  I think it would have been more valuable to capture them working on it.  The worked very intently, quickly going from "what does he mean?" and "what did we do about this?" to debating relative importance and discussing key features.  Very cool.

The research they're referencing includes:
The video with the students explaining their posters is below the poster images.


This is a solar system model - a little hard to see. They had fun developing the metaphor and the extending it. Used the idea of earth, other planets, the sun, constellations to all symbolize different roles.


(Students knew they were being taped for publication, and had a later chance to withdraw.)

Sunday, November 21, 2010

Images of Teaching

There was a nice (if long-windedly titled) article in the Decemeber '03 Teaching Children Mathematics called "Metaphors as a Vehicle for Exploring Preservice Teachers' Perceptions of Mathematics," by Brenda Wolodoko, Katherine Wilson and Richard Johnson.  In the article the preservice teachers made images to display themselves as teachers or learners of mathematics.  The majority of their images revealed anxieties about the content as learners, but hope for themselves as teachers.  The researchers liked the way that the images created an opportunity for dialogue and created a potential for change.  One interesting sidenote is that students used the idea of puzzles both positively and negatively, modeling both frustration and engagement.

My preservice elementary teachers recently made images of what does it mean to teach mathematics in small groups, and our secondary student teachers envisioned their future classrooms.  There were many neat ideas to share.

 The mullet came later, but I think they thought the "Business in the front, party in the back," slogan did relate to teaching.


 This and the next chart were imagined classrooms, which you'll see a lot of with the secondary teachers as well.  They value group work, technology, manipulatives and whole class time.  I often wish college classrooms had room for a carpet section for students to sit down.


 These next two charts are more like concept maps.  This group focused on the most important aspects to them.

While this group saw their concept map evolving into a hierarchy.  There's some pretty interesting connections here to look into.


Somehow missed my favorite poster here.  Clever use of Facebook, and really made me think about that page as a representation of who someone is.  I think there are lots of idealized people I'd be interested in seeing Facebook pages for.

The secondary teacher assistants made quick individual sketches at the end of a seminar.  So don't expect the artistic commitment we got from the elementary teachers.  One thing that came across in classroom images is the presence of the kind of technology to which they've been exposed.  It's becoming clear to me that we need to do a better job of teaching technological pedagogical content knowledge, primarily by explicit modeling.

Let's start off with a few of the text descriptions.  This teacher is worried about the content they will be forced to cover.


This teacher is thinking about classroom management as the start of learning.
I'm not sure if this teacher was describing life as it is or as they envision.  Somebody definitely considering the different models with which they've been presented.


Next come several visions of cooperative learning.  There seems to be a clear value on student discussion, and varying images of what the teacher's role is in relation.


And this sketch merges a vision of the classroom with a concept map of what is important to them.


I'd be very interested in knowing what you think about the images here and what you notice, if you'd care to leave a comment or drop an email.  Thanks!

Wednesday, April 28, 2010

Learning and Teaching Anchor Charts

One of the things that seems to be referenced on this blog are the anchor charts.  My K-8 geometry class this semester really took to them.  I'm posting the public class ones here, but they also made several interesting personal ones in their portfolios.  Several remarked on how they saw new things about what they had learned by putting it all together.  A great example of synthesis.

Deb Smith (who has shared a number of the resources at ReadingLady.com) describes it as follows, quoting from Harvey and Goudvis' Strategies That Work, which is a great comprehension text.
“Synthesizing is the most complex of the comprehension strategies.  Synthesizing lies on a continuum of evolving thinking.  Synthesizing runs the gamut from taking stock of meaning while reading to achieving new insight.  Introducing the strategy of synthesizing in reading, then primarily involves teaching the reader to stop every so often and think about what she has read.  Each piece of additional information enhances the reader’s understanding and allows her to better construct meaning .” (page 144)

“We need to explicitly teach our students to take stock of meaning while they read and use
it to help their thinking evolve, perhaps leading to new insight, perhaps not, but enhancing
understanding in the process.  To nudge readers toward synthesis, we encourage them to
interact personally with the text.  Personal response gives readers an opportunity to
explore their evolving thinking.  Synthesizing information integrates the words and ideas in the text with the reader’s personal thoughts and questions and gives the reader the best
shot at achieving new insight.” (page 144-145)


Synthesizing modes of instruction and the Conditions of Learning.


Looking at the Conditions for Learning against the backdrop of the Teaching-Learning Cycle.


Really trying to put together teacher and learner roles, with conditions, learning theories, instructional modes ... and a flower. 


Boy, they were a good class.  I'm going to miss them!

Thursday, October 1, 2009

Anchor Charts

While we did this as a teacher prep activity, I think it would be interesting with K-12 students as well. I first heard about anchor charts in Mosaic of Thought (I think), and like how they serve as both assessment and culture building. I've had students make charts about a particular concept, about what to do when you're stuck, and for what it means to do, learn and teach mathematics.

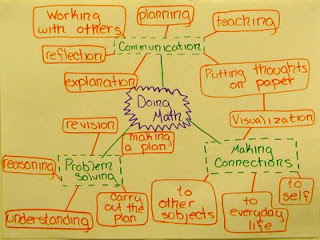
For this most recent lesson I had the students read "Mind mapping As a Tool in Mathematics Education", by Astrid Brinkman from Mathematics Teacher, Feb 2003. (They had previously expressed curiosity about and a lack of experience with concept maps.) One reason I love these is that they are frequently surprising. I expect one like this, that echoes the NCTM process standards we emphasize in the first unit: (Remember you can click images to see them full size.)


But then they go and make these completely original things like:
with different processes emphasized

and


Highlighting the difference and connection between
school mathematics and real mathematics.
Instructions to the students:

Activity: Anchor Charts
The following example comes from Ellin Keene’s (2008) To Understand: "Teachers generate anchor charts to capture and celebrate increasing sophistication in oral language use." (p. 278)
If you substitute ‘understanding learning in mathematics’ for ‘oral language use,’ you have the purpose of this activity. (Follow a link for a free pdf of the first chapter, under samples.)

Create an Anchor Chart for Learning in Mathematics
1. Identify the concepts and ideas that you want to remember as they relate to doing mathematics.
2. Develop an anchor chart that captures and celebrates your increasing sophistication in understanding “Doing Mathematics.” This might be a list, or a mind map, or a representation of your own creation. You decide – just be prepared to share your chart during our next class.
3. Be sure you leave 10 minutes to reflect.

Reflection: How well does your group’s anchor chart capture what you want your future students to think of hen you ask them “what does it mean to do mathematics?”


Home Extension: You might want to check out how math teachers use anchor charts at books.google.com - Integrating Literacy and Math. by Ellen Fogelberg, Carole Skalinder, Patti Satz, Barbara Hiller, and Lisa Bernstein.

Other interesting examples:
(OK, the last one's mine.
Fair's fair if I'm putting up my students.
No, I don't know what's up with that guy's hair.)

Send me yours or your students' and I would be happy to post that!