Showing posts with label quadratic. Show all posts

Tuesday, September 6, 2022

College Algebra: Quadratics

 I had my elementary ed class canceled for low enrollment this fall. Make of that what you will.

The replacement course is College Algebra. Ironically named, since it is mostly Algebra 2. Which is required in Michigan. Our sequence has been 097 (prealgebra) -> 110 intermediate algebra (algebra 1) -> 122 College Algebra.  It used to be + 123 (trigonometry) to go on to Calculus, but we have a nice precalc class now (124) so people needing to take calculus that don't place into it can just take 1 semester. The audience for 122 then, is now general education, and people who need courses that require it, like the basic chemistry, intro physics, and statistics. It's a 3 credit course, and my section meets twice a week.

The course has traditionally been quadratics -> polynomials -> rational functions -> exponentials -> logarithms -> light touch of statistics. So what do we want from the quadratics unit? This post is me trying to think out loud to get it straight for myself. The schedule is pretty packed, so I have 2-3 weeks per topic, 4-6 class periods.

The instructional sequence I have planned is visual patterns -> modeling (Penny Circle and Will It Hit the Hoop?) -> graphing/equation forms (Match My Parabola & Form Fix) -> solving equations (vertex form & graphing), mostly in a modeling context.

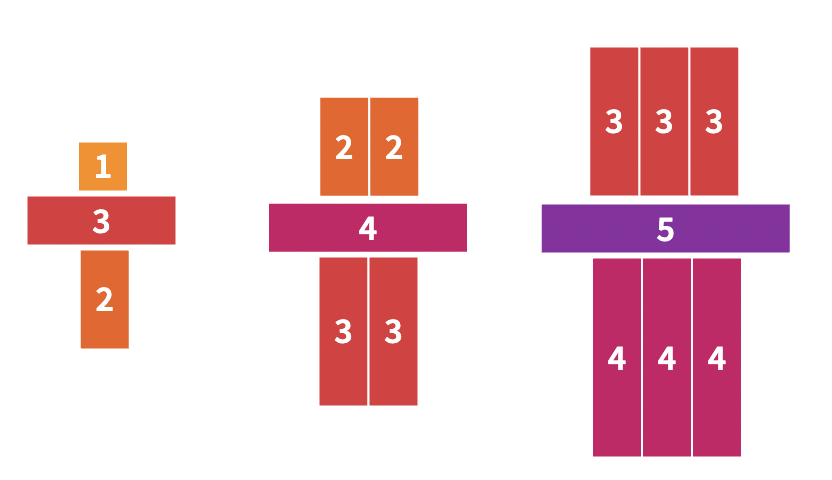
The visual patterns do a lot of work. They offer a hook, they give learners a chance to notice and wonder, they give us a chance to problem solve. They are also different from what most students have seen in algebra, sadly, so offer a way to let them know that this course might be different. I also have them read Elizabeth Statmore's post on math as a thinking class. I asked them, "What do you think the main idea is? How does this compare with your own ideas about learning math or your previous experiences?" and you can read their responses on this doc.  I think they get it. Mathematically, I think my main point is the use of variable as a relationship rather than an unknown. The transition from step number to x is very natural. Secondarily, they get to see multiple equivalent expressions. Which is one of those math ideas which many learners see as a bug, but mathematicians think is a central feature.  Part of the richness of these problems is what the old NCTM standards called the representation process standard. Tables, expressions, visual and the connections between them all move us forward. Here's a handout with four quadratic patterns. The bricks and the darts and kites are very difficult to visual make a symbolic rule for. I might have made them or might have found them at Fawn Nguyen's visualpatterns.org or it could be a mix.

Modeling is a key theme of the course, and Penny Circle and Will It the Hoop? are a good start to it. I was surprised how many learners went with an exponential form, and the reveal is the perfect way to settle it. We will be using Desmos activities a lot, and those are pretty slick introductions. The Penny Circle builds on the covariation use of variables, and the basketball leads into the graphing we'll be working on next. 

This is where we are as I write.

I'm convinced that one of the barriers for these students is understanding graphs. Thankfully, making them is easier than ever. But I don't think that many know how to think with them. Again with the representation standard, the connections between the symbolic expression and the graph is mostly taxonomical, and I want it to have meaning. Though this is a place where I could use some help. Regression supports this goal, as it brings tables into the web of connections. Activities where they vary parameteers and observe the effect on the graph help, at least in terms of taxonomy. Solving equations with graphs is an opportunity to build some of the understanding I want, as, especially for applications, the context is another piece of the representation. Writing this, I'm a little surprised by how hard it is for me to put my goal here into words. That would undoubtedly help with the teaching!

Solving equations is last for me, partly because it is so much what they perceived the focus to be in their previous math courses. I don't care especially for a lot of symbolic skill here. I don't teach solving by factoring, though the factored form in connection with graphs is something I emphasize. I do like the approach of solving from quadratic form, because it builds on a theme in math I love about doing and undoing. This leads better into exponentials and logarithms than it does polynomials and rational functions. The symbolic fluency that I want is being able to see a quadratic as series of steps. Take a number, subtract 2, square it, double it, add five is the same as  <math xmlns="http://www.w3.org/1998/Math/MathML" display="block" data-is-equatio="1" data-latex="2\left(x-2\right)^2+5=13"><mn>2</mn><msup><mrow data-mjx-texclass="INNER"><mo data-mjx-texclass="OPEN">(</mo><mi>x</mi><mo>−</mo><mn>2</mn><mo data-mjx-texclass="CLOSE">)</mo></mrow><mn>2</mn></msup><mo>+</mo><mn>5</mn><mo>=</mo><mn>13</mn></math>. To find what numbers make 13 from that function, we can do by undoing.  I love Graspable Math for this, as the dragging to undo seems to really help get across the idea, though it doesn't work on the balance nature of equations. Here's an example GM activity with 3 quadratics to solve.

I'm very interested in your thoughts. What are the key ideas you want in a quadratics unit? What am I leaving out that you love? What understanding do you want your learners to develop or skills do you want them to have for graphing? Why?

P.S.

Probably violating some internet rule here, but really liking the Twitter discussion about this post.

@DavidKButlerUoA: This line was very interesting: "multiple equivalent expressions... is one of those math ideas which many learners see as a bug, but mathematicians think is a central feature". I'd love to hear more about that.

@joshuazucker: My interpretation is that beginners may want there to be only one answer and experts see how useful it is to have multiple representations that make different behaviors immediately visible.

@mathcurmudgeon: When 90% of calculus (and every math course, really) is rewriting expressions in an equivalent form that we can work with more easily.

@mathhombre: it starts with fractions. All these different ways to write the same thing. One of them must be right. (Often supported by teachers insisting on one.)  But that we can transform, rewrite and tinker leads to fluency, connections, and meaning.

@mathforge: The belief that out of all the ways of writing it there must be a RIGHT way is SUCH an interesting belief. I've never thought before that people might believe this.

I suspect that this is more prevelant than we might admit. As experienced mathematicians we might chuckle at people who think that there is a "best" way to write, say, a quadratic or a fraction. But we probably fall into the same trap with ideas.

I might, to take a random example, think that there is a "right" way to think about differentiation, or Pythagoras theorem, or a topology, or the category of smooth functions. What I mean is, "this is the way I find most intuitive".

===

@KarenCampe: Love the visual patterns start & modeling focus. 

When you do graphing equation forms & use match my graph/form fix you will surely cover symmetry of the graphs & how factoring gives x-ints. I like how graphing & alg manipulation of quadratics are interconnected...

Use graphing as tool to support any algebraic rearranging we might want. Look for hidden parabola that shows complex roots. Axis of symm hidden in quadratic formula.

===

[In response to "Quadratics unit in a college algebra course. What goes in, what's left out? "]

@theresawills: Probably too vague, but worth saying: RICH PROBLEM SOLVING.


Saturday, June 16, 2012

Quadratic GeoGebra Day

I'm teaching a summer intermediate algebra course, and we recently had a full day of GeoGebra for quadratic functions. With GVSU's GeoGebra training coming up, it seemed like a good time to document what all we did.

I'm using a Bring Your Own Device philosophy for the class, so students are bringing TIs (82, 83, 84, 86 so far), smart mobiles, and laptops to run Desmos or GeoGebra. When we have a particularly heavy computer day, I let them know ahead, and a few extra people bring in laptops. The university runs a pretty good wireless service accessible to all students and staff.

Here's our agenda for the day:
Agenda – Class 9
Objective: quadratic regression and connections between the vertex form and standard form.

5 start up: multiplying 2 digit numbers with place value sense.
15 HW
30 Vertex investigation (GGBT - GeoGebraTube)
50 Regression opportunities (W|A, GGB, TI)
30 Projectiles
5 Classroom concerns 
To do: project 1 – linear and/or quadratic math in life.
The way the class panned out, we left off projectiles for another day. The point of that is to make a strong connection between constant second difference and constant acceleration.

Some of what we were doing was to support them in the project. Here's the handout:


It helped engagement that they knew there was something for class that this supported.

The multiplication of 2 digit numbers was a connect forward piece to multiplication of binomials, by means of an area model that shows partial products and leads to the box method for multiplying polynomials.  There were no homework questions, so we spent a while on the multiplying, and then someone wanted to know why we were doing this, so we got into the box method right then and there.

I designed this sketch to have just a and b on sliders, to focus attention on those. The class had previously noticed that c in the standard form was the y-intercept, so I made that literal in the sketch to emphasize it. I gave it a dynamic window (defining x- and y-min and max interms of function values) so that the parabola would be in view. (GeoGebra note: that means that the program is constantly recomputing when values are changed, so you can't really use the trace.) The sketch has these questions on GGBTube.
This sketch helps you investigate the ___location of the vertex for a parabola in standard form, y=ax^2+bx+c. Since the equation will tell us y if we know x, we will concentrate on the x-coordinate of the vertex.

1) There are controls for a and b, separate from c. Why doesn't c change the left-right ___location of the vertex?

2) Change a and b and notice the effect on whether the vertex moves left or right. What do you notice?

3) Our goal is to find a rule or formula for the vertex's x-coordinate in terms of a and b. How can you collect data that will help us determine the formula?

Extension: what else could you investigate with this sketch?

The vertex investigation led to a good bit of mathematical reasoning. They noticed that when a increased, the vertex moved to the right, unless b was negative in which case it moved to the left. Some discussion led them to decide that it moved closer to zero.  They noticed when b=0 that the vertex is always at x=0. They also noticed a cool parabola pattern that the vertex makes when you move the b slider.

I suggested that maybe we needed some hard data, and started recording on the board a and b vs. the x-coordinate of the vertex for what they had tried. No pattern was visible. So I suggested fixing a or b and varying the other. Now there's some interesting things to see.
(It wasn't this neat on the board.) They noticed that as b increased it got bigger ("Bigger?" I ask. "Well, more negative.") As a increased it got smaller. When a was steady, it was like a line. They noticed the -1/2 slope for when a=1. One student noticed that when b doubled, the x-coordinate doubled. Then another noticed that when a doubled, it went down by half. Then a student had the insight, "oh, I have it! I think... can I say?" (We've been working a bit on being a no-spoilers class.) Is it -b/2a?  Seemed to work with all the data we had.

Steve's Rule: x-coordinate of the vertex = -b/2a.

When students reflected on this investigation (jot down one thing you want to remember) many noted the formula, but some remarked on collecting the data and the trends in a and b as it affected the vertex.

Next I wanted to give them some practice on regression. Starting with the sketch Dan and the Ball,
which, of course, is from Dan Meyer's photo composite.  Students pretty naturally want to know if it goes in. Most think it does when you take a vote.

On this sketch you can use the red point to gather data. We talked about entering the data in the spreadsheet, from which you can use the two-variable data tool. 
Or make points from the list and use the FitPoly[ ] command.


You can also use Wolfram|Alpha to do the regression, or a TI. Unfortunately Desmos doesn't have regression yet. W|A is surprisingly finicky about the phrasing you use. For example it prefers "fit" over "regression."

 Students were very successful with this, and I had them move on to their choice of activity.

Several did the bridge problem, which looks at whether a bridge is a parabola or a catenary. They were bold about exploring, despite the many overheard comments about not having any idea what was going on with the catenary. Several also gave the bouncing ball sketch a try, which allowed them to see the effect of constant a on different parabolas. (OK, I'm also just pretty happy with the simulation.)

By that point many were looking for other things on their own. Someone found this great world record motocross time lapse shot, among others.

 
From tifr
 I made up a guide to importing and using images in GeoGebra.


One GeoGebraTube tip that I picked up from this much student use in class was to remember to change the vertical display size of a sketch if you are adding the menu bar, tool bar or input bar. About 200 pixels is enough for all three.
You get to that screen by being logged in and choosing the Edit option on the teacher page for your sketch.

This day seemed to make (by subsequent assessment) a difference in their technical ability to do regression, their understanding of the vertex formula and use of the quadratic formula, understanding of some of the features of parabolas. They also have been working with a great amount of independence on their projects.  Which I am excited to see on Monday!

Saturday, June 11, 2011

Teachers Investigate Quadratics

In our spring grad class we've spent the week looking at assessment and instruction in the context of quadratics. The pedagogical side of class was spent talking about Skemp, making a assessment concept map on Mindmeister, a rare mindmapping tool that allows realtime collaboration...

...a questioning framework (shared in this old blogpost), a video of a teacher leading a lesson on solving quadratics (from the new to me resource of Inside Mathematics, with videos, coaching, lessons and problems), sharing a variety of articles on assessment, and watching Shawn Cornally's TEDx talk.  The assessment articles included one new to me, "Using Assessment for Effective Learning," Clare Lee, Mathematics Teaching, Jan 2001.  That led me to two books (that are available online through our library), Language for Learning Mathematics, by Lee, and Learning to Teach Mathematics in the Secondary School, in which she has several chapters.  Shawn's talk is worthy of a post of it's own... really has me thinking.

Between the classes, the teachers tried to find quadratic data of their own.  One speculated about pulse rates in fight or flight situations (concave down quadratic?) but couldn't find a good set of data. Another found a neat class of problems about water draining in a quadratic pattern.  Sadly, my remaining physics doesn't let me know why that would be. One of the students did a great little think aloud using Jing (click for the short video; I don't know how to embed someone else's screencast) with a picture of a record dirt bike jump.
 He did a quadratic fit to this using GeoGebra.  The picture does not seem to be from perpendicular to the plane of the jump, which raised the nice question: is a parabola seen from askew still a parabola?   (The other nice tip he had was to use SmartNotebook for within the screencast... interesting.)

To me, one sign that students are genuinely investigating is that they get to questions that I have to think about or don't know the answer to.

With the focus being on deepening their understanding, I asked the teachers to choose from these investigations, with the addition of the water draining.

1) Galileo Galilei (essentially that means his father was named Galileo, too; so he’s Galileo Jr.) conclusively disproved Aristotle’s idea that heavier things fall faster. He took Aristotle to task for never figuring out a good way to test it. Next he wanted to study how and if speed changed during a fall. But it was too fast for his available tech. So he devised several clever ways to slow it down. One way was to roll a ball down an inclined plane rather than dropping it. (Why would this have the same information as falling?) He did one experiment by building bumps on the ramp and spacing them until the sound of the clicking over them was periodic. That’s hard to replicate in class. But another experiment was to time a rolling ball down a plane, and then find a point where it took half or a quarter of the time. (Read more at http://bit.ly/lwcK1h but after you experiment.) Try that out, take some measurements and discuss what you find. How can you get a variety of data to look for patterns?

2) There’s a famous relationship between quadratics and second differences in the output, if the inputs havea constant difference. Choose a couple of different quadratic functions and experiment, generating and organizing data.
a. What is the relationship?
b. Why is the relationship?
c. How does the relationship connect to either the standard form or vertex form of a parabola?
3) We often care about the roots of quadratic functions. Is it easier to solve for the roots a function in standard or vertex form? Why? What would the quadratic formula look like for vertex form? Could you use that to find or derive the quadratic formula for standard form?

4) Not much for visual learners here. Can you devise a pictorial growth pattern that has a quadratic relationship between input and output? Well probably it’s easy!
But there must be more interesting patterns than that. Can you make a pattern with a ≠ 1? b and c ≠ 0? How would you visualize first and second differences in such a pattern? Would the function for your pattern have roots? What would they mean?

I felt choice was important, especially for experienced students who already knew a lot about quadratic functions.  They did an excellent job with their choices, looking for something new to do.  Here are some results of their investigations.  Afterwards, they came together and shared the results and had a great discourse.

(1) Not to gender stereotype, but the boys were rolling things even before they finished reading the first question. The first attempt was rolling a tennis ball on about a -1/3 slope.  They got this data at right.  Barely any difference between linear and quadratic.  They were surprised by the small size of the a value. They thought it was quite interesting that this was a situation with distance as an independent variable and time as the dependent. (I thought that was cool but hadn't noticed or expected that.) They noticed that if they didn't know to get a quadratic, they probably would have stopped at linear, because r=.985 is clearly good enough.

I asked if they could slow it down at all.  So they immediately changed the slope and switched to a hot wheels car that would run truer.


An in between occasion, before (0,0) was included.


 This interesting question came up: is averaging the data and finding the regression curve any different from finding the regression curve on all the data? (For this one it turned out the same.) One teacher included (0,0) as a point, which raised the question should the other one using all the data use one (0,0) or three? Should they add (0,0) - because if there was some experimental effect it would not be in a theoretical point like that.  How can you tell from the data that the car is speeding up? How did Galileo notice that falling wasn't uniform?

Seems to me that real investigations always raise interesting questions.  Canned investigations raise many fewer.  The big question came up: how did Galileo know that rolling was essentially like falling?  While this was the most dramatic investigation, each of the others raised great questions and connections, too.

(2) Only one student looked into differences, with some consultation.  She quickly found a pattern relating the second difference to a.  But I put up the following GeoGebra sketch.  (File here, or as a webpage.)  The teacher checked her work because of the 4.5 2nd difference.  She realized it was because of the delta, and set to work finding the relationship between the 2nd difference, a, and delta. Excellent math detective work. We discussed the new applications of difference equations because of computers, and the weird connection with derivatives.  They noticed that b and c had nothing to do with the second difference, and how that made sense if the second difference detected quadratic behavior.


(3)  This was the one I thought was the least interesting, but the teachers found several cool bits.  First of all, they did it by rewriting the vertex form into the standard form, and then used the quadratic formula to get a vertex form quadratic equation.  But then they liked it well enough that they wondered why they had never seen it before.  It was noticed that the work they did identifying the standard form with the vertex form gave an equation for the x-___location of the vertex for the standard form, -b/2a.

I mentioned that I would never have thought of doing it the way they did, and they started wondering what I meant.  Another teacher saw a possibility, and solved directly from the vertex form, getting another quadratic equation that was even simpler.

(4) Two groups tried this.  They captured their work in photo, so it's probably just best to show.


 The teacher on the left was surprised that there was a 3-dimensional way to think about it.  The teachers on the right were surprised that there was a non-3-dimensional way to think about it.  The rightside teachers liked the idea of colorcoding from the leftside, and made an adjustment.


Left as an exercise for the blog-reader what the function rules are for these sequences.  The discussion revolved around trying to make the pattern understandable to a teacher that finds it very hard to visualize.  The unanswered question was: what would roots mean in this situation?

Our closing reflection was on what elements of the investigation allowed them to deepen understanding.  They brought up the closing discourse as well as collaboration, the manipulatives, the new questions, and trying to collect their own data.

Pretty good lessons to draw, and some quality mathematics.

Galileo Photo Credit: from Flickr, tonynetone