
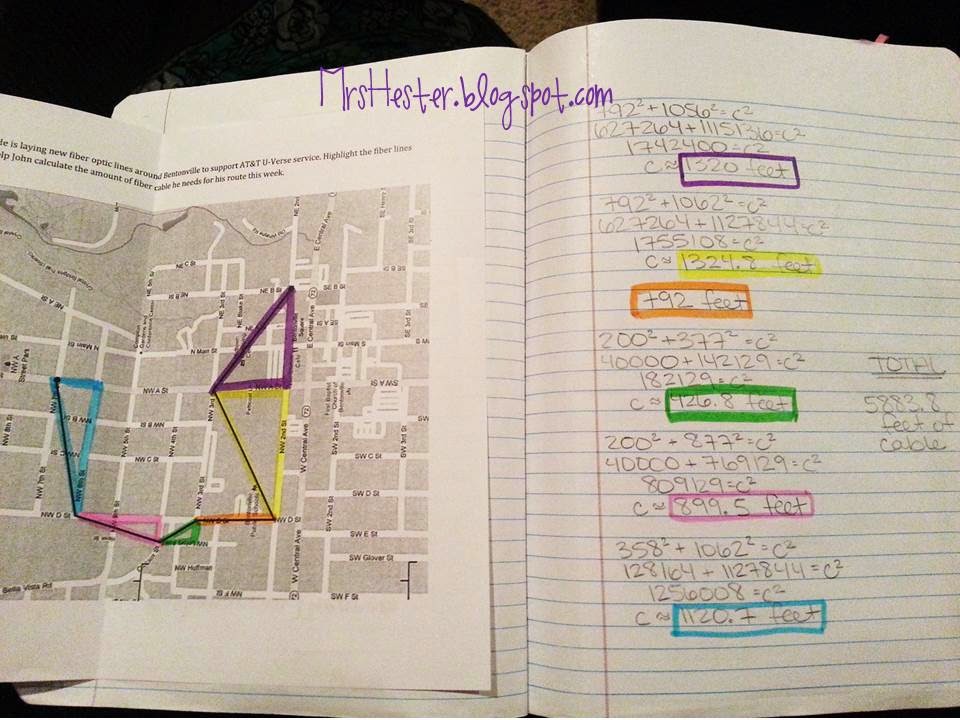
Our finished right triangle pages looked like this...

I know that's kind of a crazy picture. I used my CamScanner app and sent it to a student that was in ISS so she could check her work before moving to the next activity.
If you don't have CamScanner I highly recommend it! I can scan and save as a high quality pdf right from my classroom - huge time saver!
Anyway... next we completed this little booklet.


It was all about the relationships between areas and side of the squares formed. Never once did my students plug into a formula while completing their book - I love this! The types of problems are from Christa Lemily here, I just made it into a little booklet for their INB. The students were all commenting about how easy it was and how much sense it made. When we completed our town map next, the students were breezing through. I had to show one example about how mathematicians organize their work because we hadn't been showing work before. But conceptually, they did great!
They completed the map with more ease than my students did last year, and these students are classified as "less advanced" than my students were last year. That, to me, says the intro and conceptual booklet worked!! YAY!
Next we calculated distance between points.

When you flip the flap down that says "Calculating Distance Between Two Points" it looks like this...

Yes, I know, the distance formula is not explicitly an 8th grade standard. But if I'm doing distance between points on a coordinate grid why wouldn't I mention it?! We talked about how they would see this formula later and it contains the same math as the Pythagorean Theorem. We color coded the same work in both methods so students could see the connections. Hopefully they'll remember this at least a little next year and go look it up. Fingers crossed!

So there it is, my week of Pythagorean Theorem and distance. Got any helpful critiques or suggestions?
Here are your files: