I'm the original author of Leaflet, ask me anything! Very happy every time I see it shared on the HN frontpage.
If you're curious about the story behind Leaflet and how and why it was born 10 years ago, here's a short 13-minute presentation on this: https://youtu.be/NLbyHffKQuU
Can you please share your thoughts on advantages and disadvantages of using WebGL vs just "<img>" elements (like on Leaflet homepage) to render tiled photos that require deep zoom.
I checked how some photo zoom solutions are made. For example, Google Photos uses tiled img elements, while online photo viewer in Apple iCloud used webgl to render. And I'm not sure what's best and why.
Simply `<img>` elements should be fine for most use cases. WebGL could be used if you need much more fine grained control over the rendering — e.g. custom resampling when resizing like Lanczos filter, special effects, etc. It could also be better for performance but it's not certain and depends on the use case.
Our company made the switch from Leaflet to OpenLayers as we were unable to reproject rasters with different CRS to the map's CRS in Leaflet.
Is there any plan to add on-the-fly reprojection within Leaflet core? Is it even the core's job to deal with projection or should this be done by plugins?
This is definitely something we want to leave to plugins, since it’s technically involved, there are multiple ways to go about it with different trade-offs, and it’s not necessary for most use cases. There are multiple plugins for it though, the most recent one being Arrugator from one of Leaflet’s maintainers Ivan: https://ivan.sanchezortega.es/development/2021/03/08/introdu...
I haven't looked closely into all available plugins, but it seems that you can quickly find suitable options by searching for "leaflet wind" and "leaflet hexbin".
This depends on the scientific purpose. For most cases, I'd say yes, but I'm biased, and OpenLayers has the advantage of having all possible features baked in, if you can tolerate the complexity and bloat.
Leaflet is fantastic. One of the more interesting use cases I've seen for it is the Guild Wars 2 wiki. They use it heavily to display the game map for regions, areas of interests etc. It's quite impressive, and very useful as a player!
It's not even just video games! Leaflet's great for real-world non-video games maps of the whole world. It's by far the easiest system to make any random old image zoomable and pinchable.
My brother and I created a map of our local Costco in Figma and just put it up at https://costcomap.com/
This got me wondering if my favorite game as a kid, RuneScape, also uses Leaflet on their world map for Old School RuneScape (the version I am more familiar with). It turns out they do. Cool!
Right, leaflet can be used also outside the map context. We used it to reimplement a "Pick Your Own Seat" component (originally implemented in flash), where the user picks its own seats while buying tickets!
I'm a freelance web developer for https://gamerguides.com/ which also uses Leaflet for video game maps. It's a little weird to get working with at first but it turns out it's well suited for that sort of use case. I love it.
If you're looking for an actual demo of the product, it seems that the weather map on https://www.msn.com/en-us/weather/maps?lat=47.6032&lon=-122.... is powered by leaflet. I really like the work they've done with the wind animations and historical air quality maps
In a previous life I used Leaflet in some digital art-history publications for the Getty Museum in LA [1]. Leaflet was the MVP of our static-website software stack ("JAMstack" before that was a thing). We used Leaflet to provide maps of the Roman Empire as well as deep-zoom functionality for images of artwork. The library is a gem of open-source web technology, versatile and reliable.
OT, but I really love the Getty Museum. Definitely one of the few places worth the trip in LA. If anyone reading has access and hasn't been, consider checking it out. It's not often you see such a large collection of beautiful antiquities, particularly not in such a nice setting.
The first time I used it was to map parks and facilities for a state parks department, must have been in the early 2010s?
The design and data called for thousands of nested POIs all searchable by a range of filters (facilities, activities, etc), with pop-up info boxes and automatic clustering groups, with a custom layer from their XML-based geoserver full of park boundaries (polygons) which could filter the POIs within. By design this all required a round-trip to their geoserver which did a spatial query. The specification pushed one of the more popular JS mapping heavyweights of the day (I forget which) which due to the specific mix of required features ended up being painful, slow, janky, and with mobile-responsive becoming the frontend de-jure, a battle against nested layers of opinionated templating abstractions, all of which added up to a couple of hundred KB of dependencies and endless fragile callback-induced race-conditions, slow round-trips to their geoserver, and XML parsing issues. The mapping became a blocker on the project as the weeks wore on - hammer down one gopher, and another head would pop up. Design compromises were being considered to get the job over the line.
Enter Leaflet which was considered risky and new at the time, but on a whim and my own time I threw together a quick demo and got permission to spend a few days on it. I replaced weeks of frustrating spaghetti code and rebuilt a faster and more stable solution in a couple of days, polished it up after getting the "nod" and the site was finally ready to launch a couple of days later. Leaflet enabled the solution by being compact, only did the thing it was designed to do and didn't interfere elsewhere, and the plugins were tiny, did their job, and did it much more transparently. The main thing I had to do was transform their XML into GeoJSON on our webserver (their backend had only rudimentary GeoJSON support at the time - I think their internal teams either refused or were not allowed to update it?).
Anyway didn't mean to write a mini-blog post shilling Leaflet, it's a great library, my first experience of it was that it saved a seemingly doomed project, it does exactly what it says on the box and not much else, which is perfect when it's just a small component of a much larger and more complex project. It's my first go-to for interactive map rendering and even non-map stuff, like zoomable gigapixel photos.
I've used it and it's nice for use cases that match very closely to what they support and provide documentation/examples for. As a quick drop-in map widget on a web page, it's quite nice.
I've also used Mapbox which provides a much fancier OpenGL map with fancy things like continuous (smooth) zoom levels. Mapbox feels a lot more like a modern Google Maps-esque mapping widget. https://docs.mapbox.com/mapbox-gl-js/example/
Last I checked, IE11 is the last official holdout (with bugfixes and support) and it has less than 5% marketshare. That gives ES6 somewhere close to 95% marketshare for users that aren't running 3-6 year old insecure and outdated browsers.
You will pretty much always have to pay for the tileserver service though. The main benefit I saw was that you could trivially switch to any other tile service without being tied in to a particular one like if you used the google maps library.
You still have to pay for the server you host it yourself on. Which usually means generating the tiles from scratch rather than relying on some precached ones. The prices for something like mapbox are not outrageous for what they provide.
> You still have to pay for the server you host it yourself on.
I mean, I guess? Can't it be presumed that if you have a web site upon which you wish to place a map, you've already got a web server set up one way or another?
> Which usually means generating the tiles from scratch rather than relying on some precached ones.
Well, yes. The way I've set it up for my client is basically that we start from a large image which will be the map at its maximum "zoom in level" and run a script which scales the map 50% smaller, dices the image into 256x256 tiles, and saves those tiles with a pre-defined naming scheme (something like Xcoord_Ycoord_Zoomlevel.png - I can't recall the details), then scales the original map by 25%, creates tiles from that, and repeats until the entire map can fit into four tiles (512x512). It's not terribly difficult stuff for a reasonably capable developer to do, though working with the larger maps can eat up a lot of RAM on the system we run this script on.
If you want to roll your own tiles, you get tons of flexibility with your own tileserver, which is great if you want to change naming rules/styles/etc.. It is a rabbit hole to go down, since mapping is inherently fun.
http://maps.stamen.com/#toner/12/37.7706/-122.3782 - they have free tile servers (obviously, donate if you use them) that are relatively styled. They don't get updated and may not be 100%, but for small scale uses, they are good enough versus risking going over the free tiers at Mapbox or getting stuck in the Google ecosystem.
I’ve used Leaflet a ton and love it. But I recently tried using it with a vector-based render method (as opposed to the rastered tiles Leaflet uses by default) and couldn’t find anything that worked anywhere near as easily and simply as Leaflet’s standard rendering.
I don’t blame the Leaflet folks for this really, rendering map data locally via WebGL is not a simple task. But it’s been depressing to see folks like MapBox close off their vector-based library (and Google’s isn’t open either). There’s an open source of Mapbox’s library but it still feels like the open source world is being left out in the cold compared to how things were just a few years ago.
I'm the original author of Leaflet and also (as of last 8 years) core developer of Mapbox GL JS. Not pursuing vector rendering in Leaflet is intentional — it's designed to be extremely small, simple and lightweight. Vector map rendering is so incredibly difficult to do right that it's pretty much impossible without many years of team effort by top engineers and millions in investment.
Leaflet avoids all the complexity by relying on all the rendering done on the server, while all it has to do is load images.
Rendering vector data on the browser with the level of detalization necessary for modern cartography (hundreds of thousands of points in a single view) is not possible with the usual technologies like Canvas & SVG. The only option is WebGL, which is basically a very efficient way to draw triangles. You have to implement all the logic of turning all the data into triangles (tessellating lines, breaking down polygons, implementing anti-aliasing, figuring out collision detection between labels) from scratch, reimplementing difficult computer graphics algorithms from decades ago. This is a MASSIVE amount of work, and hard to do in a performant way.
Moreover, client-side vector rendering has even more complexity than server-side technologies like Mapnik, because you can't just render something once — you have to do it in real time, 60 frames per second, considering context, making fluid animations when zooming, panning and loading data, etc.
Yeah Leaflet never really made the jump to vector tiles. There are various ways to add vector drawing to it but as you've noted none of them are quite easy or simple enough.
MapLibre.org gives me hope. It's a fork of the MapBox GL JS code that intends to be fully open source and independent.
Another option for open source vector mapping was Mapzen's Tangram. Mapzen shut down, what, two years ago? But they open source released everything. I'm not sure if Tangram has a life of its own.
LeafletJS is not just limited to mapping applications, it is used in LibreOffice online [1] to present pixmaps of rendered documents in the web client.
There are many projects displaying georeferenced photographs using Leaflet, which usually work via precalculated hotspots in image- and mapview. Here's a project that uses photogrammetry to link not just some but all points. Clicking the photograph zooms into the corresponding position in the Leaflet-view and vice-versa.
Super handy library. I used it for a real-time collaborative map tool [1], it's especially useful when it comes to customization, plus it has many plugins which add a lot of functionality. Leaflet Geoman [2] for instance is great for creating all sorts of geometries on the map, I've personally used it for my tool so users can designate areas and paths. So good.
Just a heads up, if you are looking into using this in your project: The popup onclick triggers are currently broken in the latest version under Safari, using an older version solves it.
Other than that this is an awesome library with tons of great plugins that I’ve used for years now.
https://automuseums.info/ is using leaflet, it is also doing some server side geoclustering. It's a mostly out of the box Drupal 9 site, there's custom code but very very little.
It's pretty awesome and works well, I've used it to test Spatialite.
My only wish is that I want to generate my own raster tiles, but I've seen that planet.osm now is 1.4TB, although the .PBF is only about 60GB.
I wish I could generate tiles of areas I want, but it seems the software requirements are pretty big, I'd rather use spatialite than postGIS, and I have no idea how to generate those tiles. There are a lot of GIS softwares, and most of them are pretty heavy, not to mention there are a lot of different formats which bloats everything.
For all you React users (Reactionaries?) out there, there's React Leaflet. I'm in the process of making a little React portfolio app that randomly generates airports within a user-defined distance of each other (for all the indecisive Flight Sim users), and with this library it took all of about 20 minutes to put the airports on a map, draw a line between them, and center the map on them. Really neat stuff.
A great library. I use it daily for web work. But recently I used it in an ionic framework mobile app. Simple cross-platform mobile map from a single code base? Yes please!
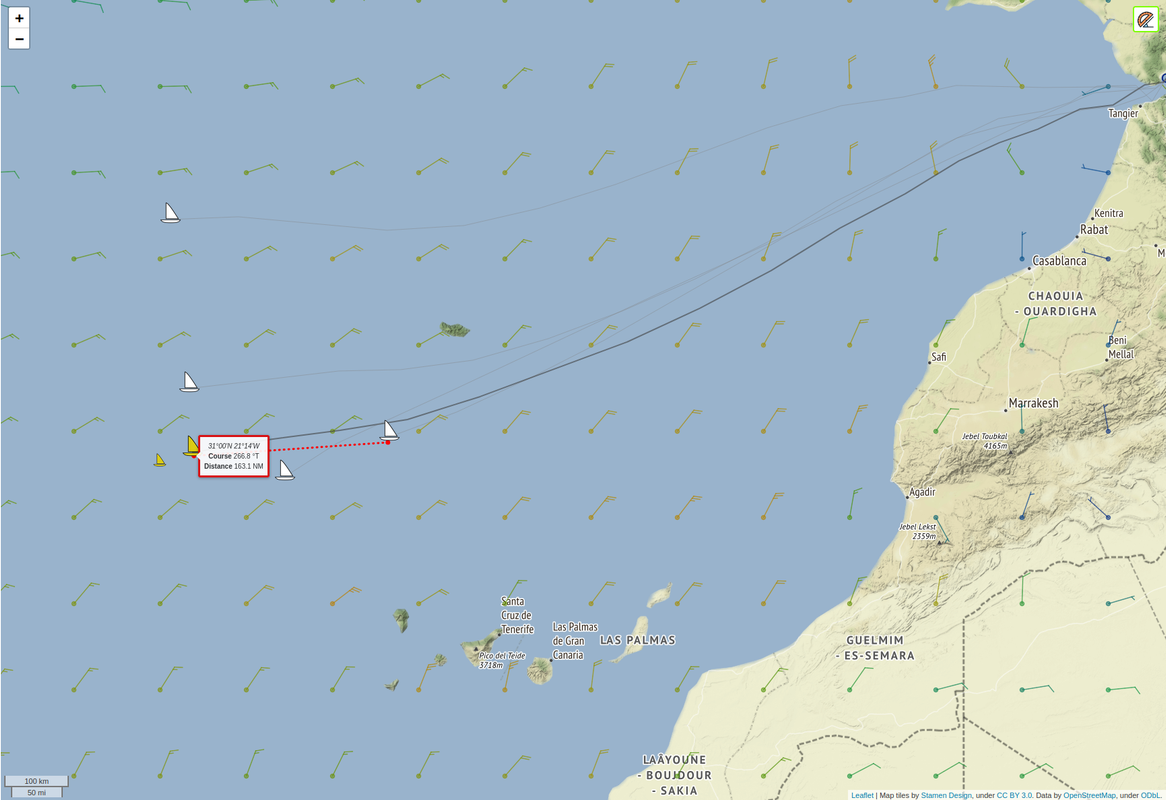
LeafletJS is great! I've been using it successfully with multiple tile layers and a few additional plugins as well (such as leaflet-ruler[0] and RotatedMarker[1]) as the foundation for the map display in my virtual sailing project. Here's a sample of what that looks like: https://i.postimg.cc/8z7DMz3T/leaflet-sample.png
Looks like the pixels it’s painting on my iPhone are double size, 2x2 squares. I might have some weird experimental WebKit features enabled or something but is that an easy mistake to make with Canvas? I suppose so.
* Leaflet is based completely on the web platform. It achieves a zoomable slippy map experience by animating DOM elements - usually image tiles.
* MapLibre GL JS is a BSD licensed fork of Mapbox GL JS version 1. Instead of consuming bitmap image tiles, it consumes tiles corresponding to the same coordinate extents as the above tiles, but containing tagged geometry features. So instead of sending a PNG image you're sending what is essentially an SVG, but in binary format and with some ___domain-specific compression.
* The GL JS renderers also rasterize those vector tiles using WebGL, which means that all the geometry data exists in GPU memory and can be scaled, rotated, and recolored etc in realtime efficiently, and also implement their own limited text rendering so even labels can be rotated in realtime.
I’m working on a writing prep web app that will have an interactive map feature. How nice for this to show up on the hn front page, I assumed I’d be making something custom in threejs until now.
It’s called plotbinder - the app and it’s website (plotbinder.com, currently nothing is hosted) should go online sometime in September
Leaflet for R is fantastic as well. It has been a while since I have used R so there might be something better now, but I have fond memories of that package.
One thing question that I have.
If I want to use an image as a source of my tiles.
Should I split the image into chunks to load them when user moves the map around? Or is there any other way to do that? Are there any tools that would help split an image into those chunks?
Depends on your use case. If it is a very very large image, then yes you should split it into tiles. If the image is simply large and you want to use leaflet as a panning tool, then simply loading it as is should be fine.
I used leaflet for a previous project involving maps of users (https://tagmap.io/tag/slatestarcodex is an example of one), and my experience with it was wonderful; I'd be happy to use it again next time the need arises. The best part about it for me was perhaps how easily configurable it is, including easily adding additional plugins (for example, we used one called MarkerCluster to cluster markers for users if there were hundreds or thousands in the same area. Changing the style of markers, adding new ones, and so on, was also trivial). Nice library and experience in general.
If you're curious about the story behind Leaflet and how and why it was born 10 years ago, here's a short 13-minute presentation on this: https://youtu.be/NLbyHffKQuU