TRACING THE ANCESTORS OF MPONDO CLANS
ALONG THE WILD COAST OF THE EASTERN CAPE
David de Veredicis
0603298x
A dissertation submitted to the Faculty of Health Sciences, University of the Witwatersrand,
Johannesburg, in fulfilment of the requirements for the degree of Master of Science in
Medicine in the Division of Human Genetics
Pretoria, 2016
�Declaration
I, David de Veredicis, declare that this dissertation is my own work, unless otherwise stated.
It is being submitted for the degree of Master of Science in Medicine in the branch of Human
Genetics, in the University of the Witwatersrand, Johannesburg. It has not been submitted
before for any degree or examination at this or any other university.
....................................................
.............day of........................., 2016.
ii
�Abstract
Oral history and anthropological data indicate that several Xhosa clans in the mPondoland
region of the Eastern Cape (formerly the Transkei) were established by individuals of nonAfrican ancestry. Several oral and few written accounts state that circa 1730, survivors from
trade- and slave-bearing vessels shipwrecked along the Wild coast of the Eastern Cape.
Castaways who had survived the shipwrecking events had assimilated with the indigenous
people of the area, married local women, and established clans of their own. The group of
clans, which claim their ancestors to be of European and/or Eurasian descent, are known
as the abeLungu, meaning “the Whites”. These clans are discerned from other local groups
by variations in the practice of rituals from that of traditional Xhosa rituals, as these clans
retain an affiliation with the European culture to which their ancestors belonged. Nowadays
they still retain subtle phenotypic features like blue eyes, which are seen in several clan
members. The identity of these clans has, to date, been shrouded in myth due to conflicting
versions in the oral history and anthropological data, which leave the picture of the cultural
identity of the abeLungu people unresolved.
With the advent of molecular biology, it has been shown that DNA may be used as a tool to
trace population ancestry. The non-recombining region of the Y chromosome (NRY) serves
as a marker for patrilineal ancestry and similarly mitochondrial DNA, which is inherited from
mother to progeny, serves as a record for the matrilineal human history.
This study aims at exploring the degree of agreement between culture and genetics by
investigating the genetic variation of the abeLungu - a culturally and geographically defined
group. Focus is placed on their patrilineal history, since their oral history indicates clan
progenitors to be predominantly male, but also due to the patriarchal social structure with
regards to marriage and kinship of the abeLungu.
Buccal swabs were taken from which extracted DNA was used to perform Y chromosome
microsatellite short-tandem repeat (STR) and SNP minisequencing using a total of 60 SNPs
and 19 STRs taken from 146 abeLungu clan-affiliated individuals and 42 non-clan members
from the greater region of mPondoland. Mitochondrial DNA SNP determination and
sequencing analyses were also performed on 188 males and 10 females (the wives/ direct
relatives of primary male clan elders), so as to trace the matrilineal origins and examine the
congruence between the molecular and anthropological data.
iii
�The frequency of European and Eurasian haplogroups in the male samples was 69.86%,
which are delineated predominantly by European haplogroups R1b, and West Asian
haplogroup R1a1a. Haplogroups G, I and Q which occur at high frequencies in Europe and
Eurasia were observed as well. It has also been observed (which was as expected) that
culturally defined groups with a unique (or a limited number of) common origins whose
membership is inherited only through the male line showed a relatively low intragroup
variation for genetic markers similarly transmitted. The maternal lineages of the abeLungu
clan members segregate with ancient and deeply-rooted African haplogroup L lineages, with
increased diversity on account of migration due to their exogamous marriage practices.
This study affirms the non-African paternal origin of the abeLungu clans of lineages
originating from few distinct founders, and elucidates the previously unresolved oral
accounts of genealogical information, which has been transferred across generations with
considerable accuracy, despite its propensity for change over time.
iv
�Acknowledgements
I would like to acknowledge and thank:
My supervisor, Prof Himla Soodyall, for her continued guidance and support as well as her
encouragement, patience and advice during the course of this project.
Ms. Janet Hayward Kalis, (Lecturer, Department of Anthropology, School of Humanities, Walter
Sisulu University), for her collaboration and wealth of knowledge regarding the anthropology
component of this study.
Mr. Qaqambile Godlo, who was our interpreter between isiXhosa and English in the field.
Ms. Rajeshree Mahabeer, Ms. Pareen Patel and Mr. Thijessen Naidoo of the HGDDRL unit, as well
as Ms. Thandiswa Ngcungcu and Ms. Jackie Frost for their guidance and their assistance with the
training in laboratory methods for this research and their input in the analysis component of the study.
I would also like to acknowledge the following sources of funding, the University of the
Witwatersrand and the Genographic Consortium.
On a personal note, I would like to thank my parents, Dr. Nicola de Veredicis and Dr. Shifra Klebanoff,
my brother, Mark de Veredicis, and my girlfriend Ashleigh Duckitt, who stood by me and gave me
their guidance and encouragement throughout, and offered all their love.
v
�Table of contents
Declaration........................................................................................................................... ii
List of figures and tables ..................................................................................................... ix
Appendix Figures and Tables .............................................................................................. x
CHAPTER 1.........................................................................................................................1
Introduction ..........................................................................................................................1
1.1 Background and history of the abeLungu clans .............................................................1
1.1.1 The Wild Coast, shipwrecks and the clans of their castaways ................................1
1.1.2 The origins of the abeLungu ....................................................................................2
1.1.3 The amaMolo ..........................................................................................................5
1.1.4 Secondary clans and multiple castaway settlements ..............................................8
1.1.5 The clan system ......................................................................................................9
1.2 Molecular Anthropology ...............................................................................................10
1.2.2 Y chromosome haplogroups and phylogeographic variation .................................13
1.2.2.1 European and Eurasian haplogroups .............................................................15
1.2.2.2 African Y haplogroups ....................................................................................18
1.2.3 Y chromosome Short Tandem Repeats (Y-STRs) and Y-haplotypes....................19
1.3 Matrilineal ancestry ......................................................................................................19
1.3.1 Mitochondrial DNA ................................................................................................19
1.3.2 mtDNA phylogeographic variation and inferring matrilines ....................................21
1.3.2.1 African mitochondrial haplogroups..................................................................23
1.3.2.2 Non-African mtDNA haplogroups....................................................................25
1.4 Aims and objectives of the study..................................................................................27
CHAPTER 2.......................................................................................................................29
Subjects and Methods .......................................................................................................29
2.1 Subjects and sampling .................................................................................................30
2.1.1 Ethics approval for study .......................................................................................30
2.1.2 Sampling and research area .................................................................................30
2.2. Laboratory Methods ....................................................................................................35
2.2.1 DNA extraction and quantification .........................................................................35
2.2.2 Molecular methods for Y chromosome DNA studies .............................................35
2.2.2.1 Y-STR genotyping ..........................................................................................36
2.2.2.2 Y chromosome binary marker screening ........................................................37
vi
�2.2.2.3 Additional marker screening ...........................................................................41
2.2.3 Mitochondrial DNA molecular methods ................................................................42
2.2.3.1 Mitochondrial D-loop HVR sequencing ...........................................................42
2.2.3.2 Mitochondrial SNaPshotTM sequencing (MTSS).............................................44
2.3.1.1 Y chromosome haplotype networks ................................................................47
2.3.1.2 Database search queries ................................................................................47
CHAPTER 3.......................................................................................................................50
Results ...............................................................................................................................50
3.1
Y chromosome DNA studies ....................................................................................50
3.1.1 Y chromosome haplogroups..................................................................................50
3.1.2 Y chromosome DNA haplotype variation...............................................................53
3.1.2.1 Y chromosome variation linked with Eurasian origins: haplotypic variation
within the amaMolo .....................................................................................................59
3.1.2.2 Haplotypic variation within the primary abeLungu clans .................................60
3.1.2.3 Haplotypic variation within the secondary abeLungu clans .............................63
3.1.2.4 Y chromosome variation linked with African origins ........................................69
3.2
Mitochondrial DNA findings ......................................................................................74
3.2.1 MtDNA haplogroups ..............................................................................................74
3.2.2 MtDNA haplotype diversity ....................................................................................78
CHAPTER 4.......................................................................................................................81
Discussion .........................................................................................................................81
4.1 Y chromosomes and genetic heritage..........................................................................81
4.1.1 Y chromosomes and the founding fathers of the abeLungu ..................................81
4.1.2 The amaMolo and their affiliation with the abeLungu ............................................85
4.1.3 Multiple founding events ........................................................................................86
4.1.4 Clan-affiliated Africans ..........................................................................................87
4.1.5 Factors which shape clan diversity ........................................................................88
4.2 The maternal legacy of the abeLungu..........................................................................91
4.3 In summary of the findings ...........................................................................................95
4.4 Future Studies .............................................................................................................96
4.5 The impact of human population diversity and genetic genealogy studies ..................98
4.6 Genealogy testing and its limitations............................................................................99
vii
�4.7 Biomedical and forensic impact of population diversity studies .................................102
4.8 Social cohesion and making a new South African demographic history ....................104
CHAPTER 5.....................................................................................................................106
Concluding remarks .........................................................................................................106
5.1 Testing the oral history of the abeLungu ....................................................................106
References ......................................................................................................................108
APPENDICES..................................................................................................................123
Appendix A: Ethics ...........................................................................................................124
Appendix B: SNP-marker panels for SBE multiplex assays .............................................125
Appendix C: Clan genealogies.........................................................................................127
Appendix D: Variant sites of unique mtDNA haplotypes ..................................................134
Appendix E: Comparative data sources ...........................................................................142
Appendix F: Preparation of solutions ...............................................................................144
viii
�List of figures and tables
Figures
Figure 1.1. Partial pedigree of the amaMolo clan……………………………………………………………………6
Figure 1.2. Nqulo (praise) to the ancestors of the amaMolo………………………………….............................11
Figure 1.3. Geographic distribution map of Y chromosome macro-haplogroups……………………………….14
Figure 1.4. Schematic overview of the mitochondrial DNA molecule………………………………………….…21
Figure 1.5. Global distribution map of mtDNA haplogroups………………………………………………….……22
Figure 2.1. Schematic overview of methods employed in the study................................................................29
Figure 2.2. Photographs of three male subjects featuring blue eyes……………………………………………..31
Figure 2.3. Research area of the study………………………………………………………………………………34
Figure 2.4(a) The Y chromosome SNP phylogeny……………………………………………..............................38
Figure 2.4(b) An electropherogram showing the markers screened for using the YSNP1
SBE marker panel…………………………………………………………..……………………….38
Figure 2.5. MtDNA SNP-marker phylogeny………………………………………………………………………….45
Figure 3.1. Phylogeny and frequency distribution of Y chromosome haplogroups………………………………52
Figure 3.2. Haplogroup R1a1a (R-M198) RMJ network……………………………………………………………59
Figure 3.3. Haplogroup R1b (R-M343) RMJ network……………………………………………………..………..62
Figure 3.4. Haplogroup I (I-M170) RMJ network…………………………………………………………………....64
Figure 3.5. Haplogroup E1b1a1a1c1a (E-M191) RMJ network ……………………………..............................70
Figure 3.6. Haplogroup E2b1a (E-M85) RMJ network…………………………………………………………..…71
Figure 3.7. Haplogroup E1b1a1 (E-M2) RMJ network………………………………………...............................72
Figure 3.8. Haplogroup B2a1a1a1 (B-M152) RMJ network……..…………………………………………………73
Figure 3.9. Distribution of mtDNA haplogroups by clan…………………………………………………………….75
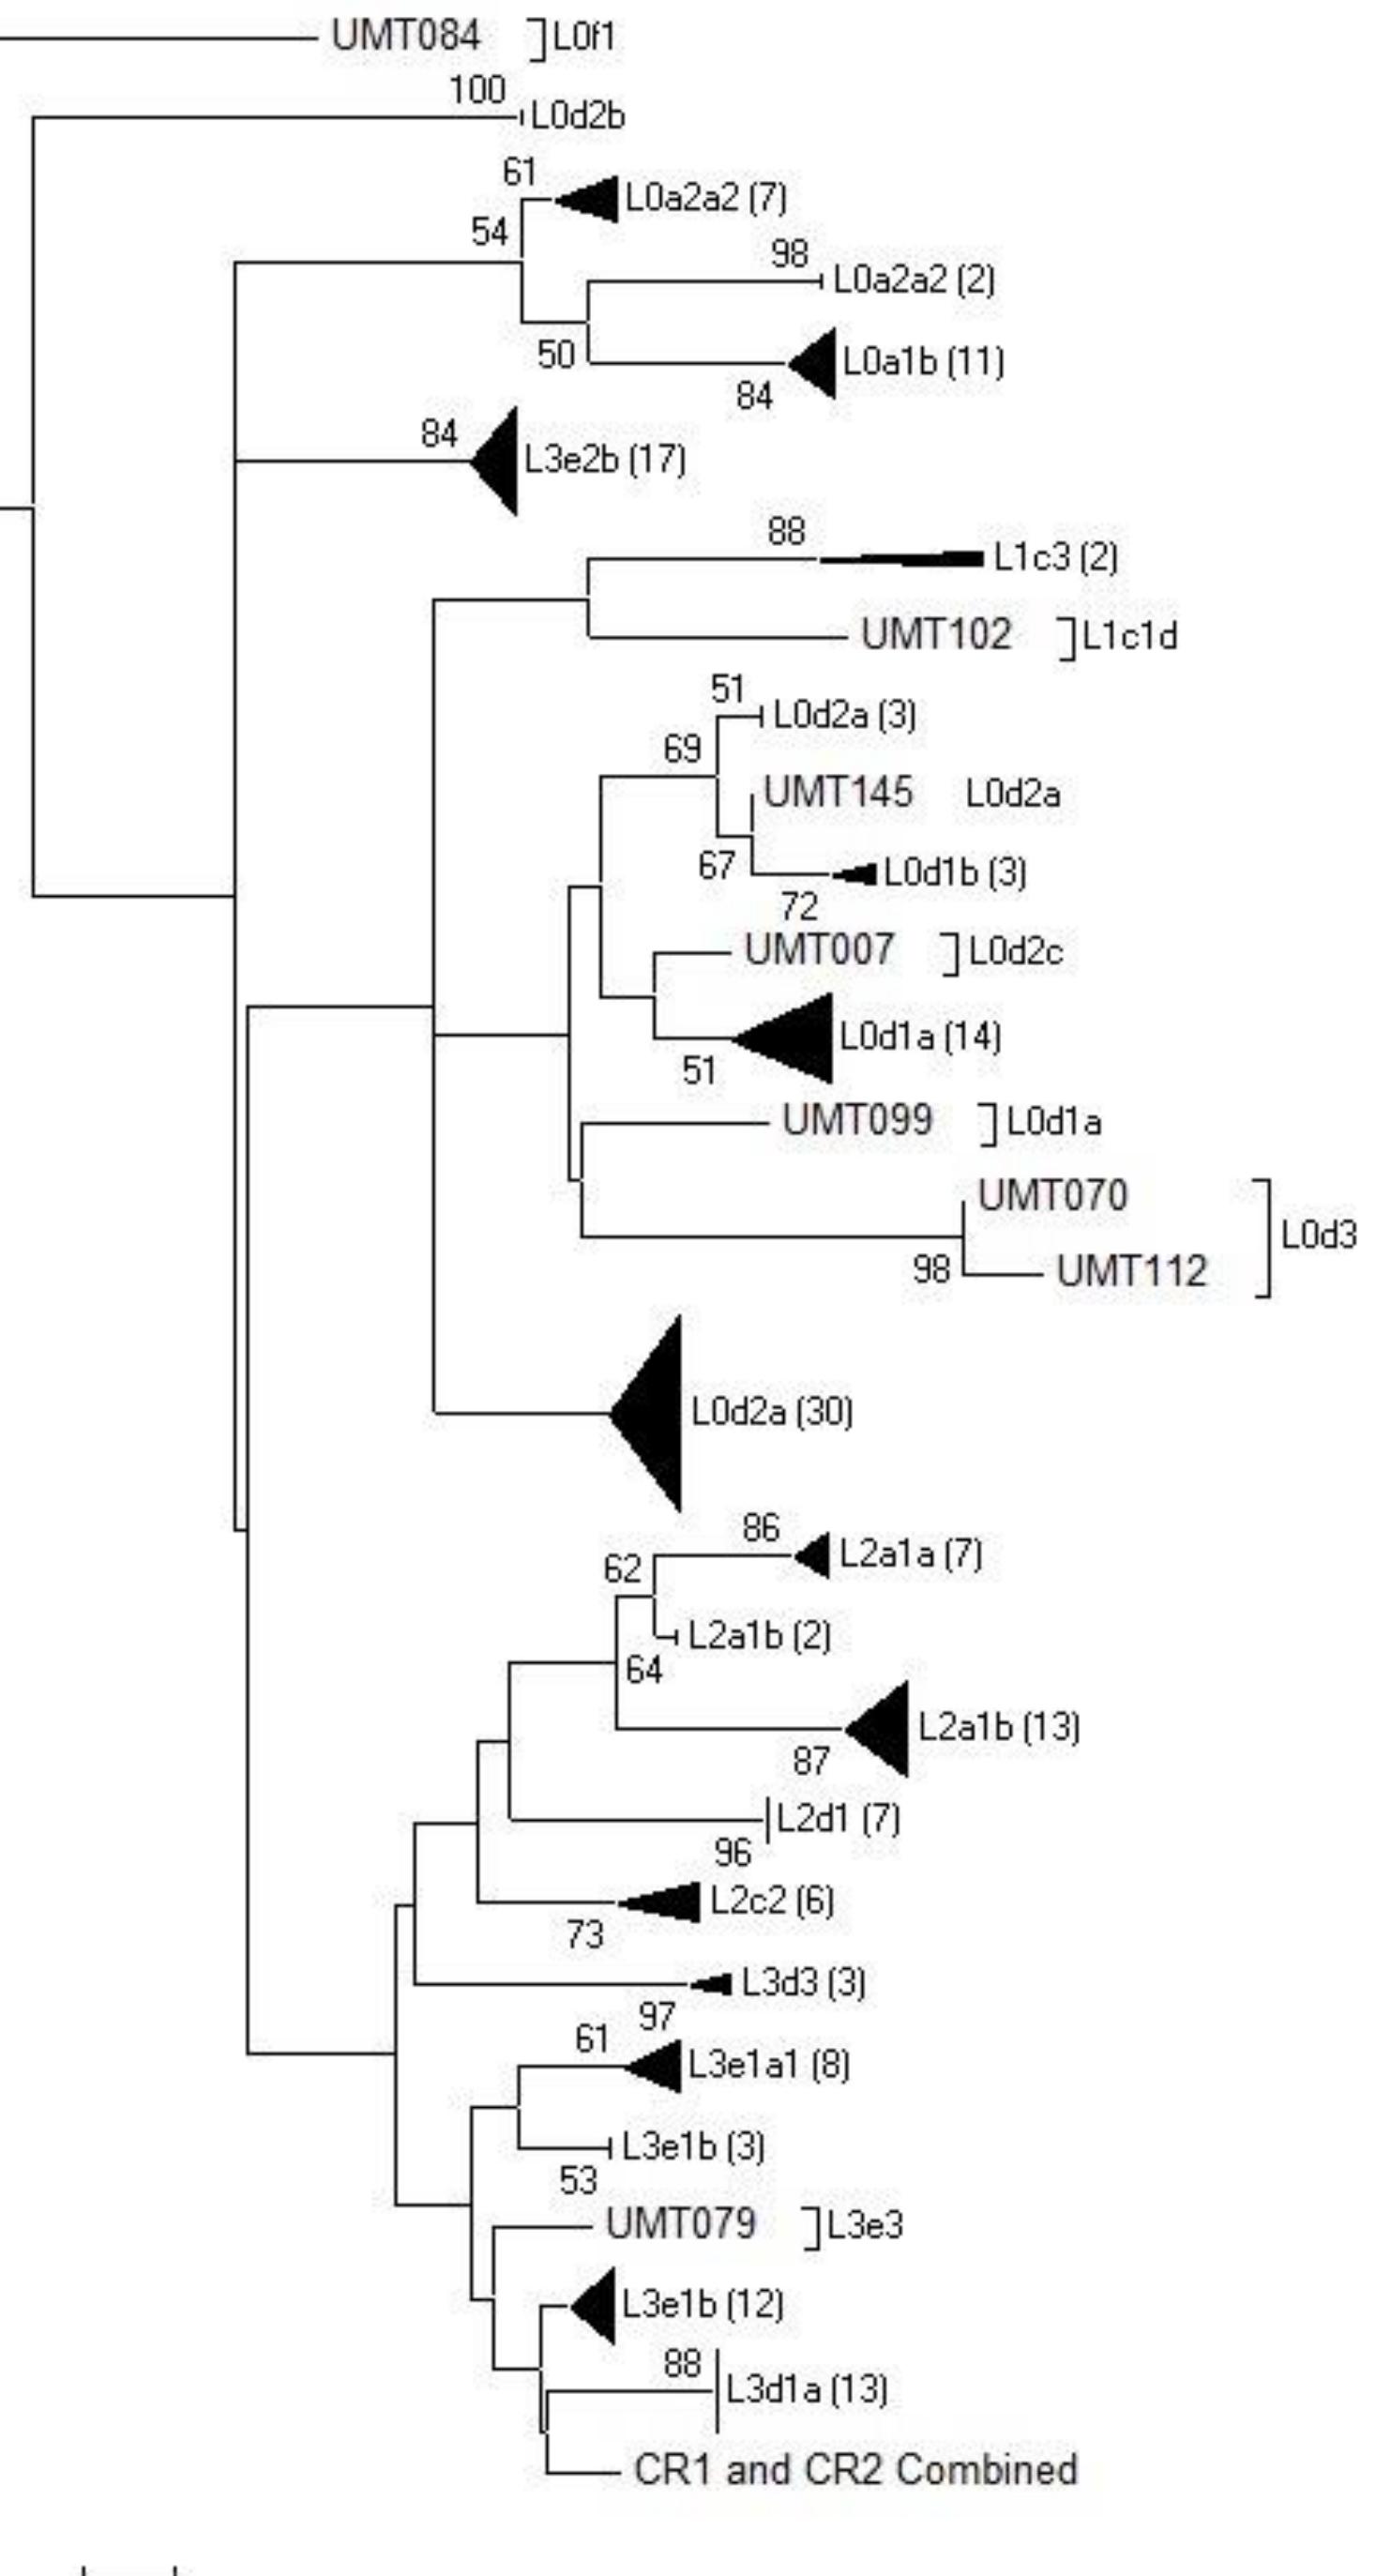
Figure 3.10. Neighbour-Joining (NJ) phylogenetic tree of 176 mtDNA haplotypes………………………………79
Figure 4.1. The amaTshomane clan genealogy…………………………………………………………………….95
Tables
Table 2.1. Geographic sampling regions of abeLungu clans……………………………………………..…........33
Table 2.2. Amplification of Y-STR loci……………………………………………………….................................36
Table 2.3. YSNP1 SBE multiplex PCR reagents……………………………………………................................39
Table 2.4. SBE PCR thermal cycler conditions………………………………………………………………….....39
Table 2.5. Post-PCR purification reaction reagents………………………………………….……………………..40
ix
�Table 2.6. YSNP1 Multiplex SBE reaction………………………………………………………………….……….40
Table 2.7. Primer sequences for the mtDNA1kb D-loop PCR amplification………………………………….….42
Table 2.8. Primer sequences for HVR I & II cycle sequencing………………………………..............................43
Table 3.1. Y chromosome haplogroup distribution for non-clan affiliated samples ………..............................51
Table 3.2(a). Non-African haplotype distribution list………………………………………………………………..55
Table 3.2(b). African haplotype distribution list…………………………………………………………………..….57
Table 3.3. Haplotypes and presumed geographic origins of abeLungu clan founders……...............................67
Table 3.4. MtDNA haplogroup frequencies………………………………………………………………………..…77
Appendix Figures and Tables
Appendix Figures
Figure S1. amaMolo clan genealogy…………………………………………………………………...128
Figure S2. abeLungu Jekwa clan genealogy………………………………………………….............129
Figure S3. abeLungu Caine & Horner clan genealogies…………………………………….............130
Figure S4. abeLungu Hatu clan genealogy…………………………………………………………….131
Figure S5. abeLungu Ogle, Irish, France,Thaka & Buku clan genealogies………………………...132
Figure S6. abeLungu Fuzwayo, Hastoni & Sukwini clan genealogies………………………………133
Appendix Tables
Table S1. Y chromosome SBE marker panels…………………………………………………..........125
Table S2. Unique mtDNA haplotypes…………………………………………………………………..134
Table S3. Comparative data sources…………………………………………………………………...142
x
�List of abbreviations
AIMs - Ancestry Informative Markers
CMH - Cohen Modal Haplotype
D-loop - Displacement loop
DNA – Deoxyribonucleic Acid
ddNTPs - Dideoxynucleotide-triphosphates
GWAS - Genome-wide association studies
HCV - Hepatitis C virus
HVR - Hypervariable Regions
ISOGG - International Society of Genetic Genealogy
minHt - Minimal haplotype
mtDNA - Mitochondrial DNA
NJ - Neighbour-Joining
NPTs - Non-patrilineal transmissions
NRY - Non-Recombining region of the Y chromosome
RMJ - Reduced-median-joining
rCRS - Revised Cambridge Reference Sequence
SWGDAM - Scientific Working Group on DNA Analysis Methods
STR - Short Tandem Repeat
SBE - Single Base Extension
SNPs - Single Nucleotide Polymorphism
TMRCA - Time to the Most Recent Common Ancestor
YHRD - Y-STR Haplotype Reference Database
VOC - Vereenigde Oost-Indische Compagnie (United East-India Company in Dutch)
xi
�xii
�CHAPTER 1
Introduction
1.1 Background and history of the abeLungu clans
1.1.1 The Wild Coast, shipwrecks and the clans of their castaways
mPondoland is a region on South Africa’s Wild Coast which forms part of the Transkei
republic in the Eastern Cape. The mPondo are one of 12 Xhosa speaking tribes who
had settled in mPondoland between 500 and 1200 years ago (Soga, 1930). At the
time the cultural territories were divided, with Khoi pastoralists dominating the area
around Port Elizabeth, San hunter-gatherers lived in the Drakensberg foothills and
Nguni mixed-farmers lived throughout the Transkei, while the mPondo resided closer
to the coast (Soga, 1930). Today the Transkei and its Wild Coast are still in a
developmental backwater and, even though South Africa has been in a state of
developmental transition since 1994, service delivery in this region has been so slow
that for many people things have not improved much. The history of the abeLungu
exemplifies a point in human history when foreigners from very distant shores
harmoniously integrated with indigenous populations, in strong contrast to some of the
more recent political history of racial prejudice and segregation in South Africa (Soga,
1930; Crampton, 2004).
The coastline of the Eastern Cape is notoriously harsh, and estimates are that there
are famous accounts for at least 20 shipwrecks which have occurred in the period
c.1500-1800 along the Wild Coast alone, and numerous others which have gone
unaccounted for, since Vasco de Gama first rounded the Cape of Good Hope in 1498
(Crampton, 2004). Some of the more well-known accounts of the wrecks and their
castaways include the Sâo Joâo Baptista, which ran aground east of the Kei River in
1622, the Stavenisse of 1686, the Bennebroek of 1713, the Doddington in 1755 and
the famous Grosvenor which met its fate in 1782 (Soga, 1930; Crampton, 2004).
During the course of history, however, a number of castaways, with no option of
returning to their homes, had harmoniously integrated with local communities of
mPondo people, even marrying into them, living out their days not far from where their
ships went down. Regarding whites who assimilated, often times the extent of
1
�integration was marked, for example Stephen Taylor accounts that “…even more
curious perhaps are those white men and women who have felt called to enter
initiation, train as diviners and establish homesteads and followings in rural areas and
beyond” (Taylor, 2005; Kalis, 2010).
Near Mthatha, the capital of the Transkei, at the Xora River Mouth, exists a clan family
known as the abeLungu, who proclaim that they are descendants of European (white)
castaways. Theories of the clan’s origins are linked to the story of the arrival of a young
girl named Bessie on the Wild Coast, however details of her arrival remain unclear
(Soga, 1930; Crampton, 2004; online reference 1 and 2).
1.1.2 The origins of the abeLungu
The Xhosa have a saying which states that “If you want the truth, get it from the
original, rather than from one who has heard it second hand” (Crampton, 2004). With
this in mind, key resources by authorities on the abeLungu include Xhosa-Scot
historian John Henderson Soga in his account of The South-East Bantu (Soga, 1930)
and Hazel Crampton in her novel The Sunburnt Queen (Crampton, 2004), as well as
first-hand interviews with extant relatives of abeLungu clans of the Wild Coast which
were performed in the field by my collaborator, anthropologist Janet Hayward Kalis
(Kalis, 2006-2010, personal communications).
The abeLungu, or the “Whites”, are a black, Xhosa-speaking clan whose origins can
be traced to three white, English castaways, who were named Jekwa, Hatu and Badi.
While Jekwa, Hatu, and Badi are cited as the progenitors of the abeLungu, they were
not the only foreigners from whom the clan descends. Crampton (2004) learned that
the name abeLungu comes from the isiXhosa word meaning white foam, referring to
the frothy sea foam from where their ancestors had emerged and had originally been
encountered by the mPondo people. The abeLungu take pride in their unusual history,
but, as time goes by, it is slowly being forgotten (Crampton, 2004). Clan members
have become more confused about their history and through time, with names and the
sequence of their progenitors beginning to blend into a potpourri of castaways, dates
and wrecks. Upon interviewing contemporary members, the situation had declined
further, exacerbated by the fragmentation of traditional life due to the migrant labour
system and westernisation. Oral history serves as a tool for passing on a cultural
2
�identity and a system of values, and in the telling and retelling the tale of the abeLungu,
filtered down through several generations, different patterns have been woven into the
whole, but the basic fabric holds true. A famous narrative about foreign shipwreck
survivors becoming integrated into the local population is that of Bessie. The ship in
which Bessie was a passenger remains unconfirmed to date, but it is suspected that
she may have been aboard one of the Dutch East India (VOC) vessels which became
wrecked sometime around 1737. Bessie was just one of thousands of people of
various nationalities who were castaway on the shores of the Eastern Cape over the
centuries. Survivors who did not wish to return to their homelands and their previous
lives, sought to take refuge with the local clans of their new found emplacement. Many
of these stories may have been lost forever, but some like that of Bessie remain as
part of the South African oral narrative. This is mostly because Bessie, a white woman,
most probably of British descent, came to marry into the amaTshomane royal family,
thus she is remembered in the oral histories of her people. This was further enabled
as two of her children were still living when the first English missionaries visited the
area in the 1880s, and so, her story had been recorded in written history and was not
lost (Crampton, 2004).
From an excerpt of Crampton’s novel: “It was on this notorious coast, at about the
same time that a Dutch fleet was destroyed in Table Bay in (1737), huddled against a
rock lay a little, white, English girl named Bessie, who was cast ashore from her ship,
at a remote spot known as Lambasi (the Bay of Mussels)...” (Crampton, 2004, p.12).
In time Bessie acquired a Xhosa name, Gquma which means “the roar of the sea”.
Even though Gquma became more frequently used, she never forgot her real name
and later, even named one of her children Bessy (Crampton, 2004).
Furthermore, “…legend has it that she was not alone, but the theory as to who her
companions were still remains a mystery” (Soga, 1930, p.379). From Soga’s account
we understand that there were “…four in number; three males and one female child”,
who were named Jekwa, Hatu, Badi, and Gquma, respectively. The first two were
thought to have been brothers, and the young girl was believed to be the daughter of
Badi. According to the mPondos, they were relatives of one another “as they came
from the same ‘house’, (viz. the ship) …” (Soga, 1930, p.379). However, this need not
be accepted as true since the mPondo are a polygamous society and family relations
3
�operate differently, so it is important to note that the terms ‘brother’ may have a wider
application and meaning in isiXhosa than in English, which may not necessarily reflect
biological relations. It is in this context that the relationships of Bessie and her fellow
castaways should be understood (Crampton, 2004). The several accounts that have
survived the intervening centuries, are fragmented and contradictory, falling largely
into two camps: one in which the girl’s companions are said to have been white men,
and the other in which her companions are said to have been black, which may be
interpreted that her companions could have also been Indian or Arabic. “Several
slaves were with her…and were ‘black’ with long hair…” (Crampton, 2004). Soga
(1930) contrastingly claims that all of Bessie’s accompanying castaways were white.
From the independent expeditions of Dutch traders Hubner in 1736 and van Reenen,
in 1790, several clues contribute to better understanding the mystery of Bessie and
her Englishmen’s origins (Crampton, 2004; Soga, 1930). Hermanus Hubner who
headed an ivory-trade expedition in 1736, discovered a clan where three European
shipwreck survivors (named Miller, Clerk and Billyert) resided with “numerous wives
and offspring who had been shipwrecked many years before” (Crampton, 2004). It is
about 50 years later where van Reenen on his expedition had also discovered a place
with about 400 persons of mixed race, and three elderly women who had survived a
wreck sometime around 1730, who were presumably of the same party as that
encountered by Hubner (Crampton, 2004). Judging by the date, one of the women
that van Reenen came in contact with was Gquma’s (Bessie’s) daughter, Bessy, and
so it is evident that both Hubner and van Reenen are referring to having met the same
woman, and that it is fairly clear that this group of mixed race existed some time before
1730 (Soga, 1930).
Since the Dutch butchered English names as badly as they did isiXhosa, and the
names of the three English men who were encountered by Hubner in 1736 have a
great resemblance to those of Bessie’s three fellow castaways, it is therefore possible,
that through examining their conversion into English, Hendrik Clercq becomes Henry
Clarke; Tomas Willer becomes Thomas Miller; and Wellem Billyert may have been
(Bill) Elliot or perhaps even Billy Hart. When juxtaposed with the names of Bessie’s
white men, the result is striking. ‘Hatu’ resembles ‘Henry’ and ‘Badi’ ‘Billy’ enough to
suggest that the former are simply Xhosa-ised (corrupted) versions of the latter.
4
�Finally, if Henry and Billy were Hatu and Badi, Thomas Willer (or Miller) must have
been the man known as Jekwa. It was, and in fact still is, customary for a man to take
on a new name when he became chief, and his Xhosa name, Jekwa, was probably
bestowed on him when his mentor, Chief Matayi, appointed him as Chief of the
abeLungu (Soga, 1930; Crampton, 2004).
Bessie grew to be an extremely attractive adolescent, who eventually caught the eye
of Tshomane, Great Son of the Tshomane chief Matayi, who would eventually marry
her and make her his Great Wife. Mysteriously, Tshomane died soon after their
marriage, without an heir, and so the chieftainship was taken up by a close relative,
Xwebisa (also known as Sango). In time Gquma (Bessie) married Sango, who became
the Paramount Chief of mPondoland. This was initially met with great shock and
disapproval as it implied the breaking of strict incest taboos. A very strong 'exogamy'
law exists among the Xhosa where it is considered incestuous to have any sexual
relations, let alone marry a person belonging to the same clan (Soga, 1930; Crampton,
2004).
Gquma and Sango had three sons, and a daughter, Bessy, who were
physically markedly different to the other clans-children: ‘Several children were
“yellow” in colour, having long hair and blue eyes’ (Soga, 1930; Crampton, 2004). It is
understood that Bessie had died sometime around 1810, aged about 80. Crampton,
quoting Scully (1984), accords Bessie a very romantic end: “On the day she died she
was, at her own request, carried down to the cleft in the reef where she partly lifted up
herself, and pointed across the sea, turned, and gave out her life with a long drawn
sigh”. “In the night a terrible storm arose, and the shore was found strewn with myriads
of dead fish” (Crampton, 2004).
1.1.3 The amaMolo
Although castaways were predominantly European, a large number of people were of
other races and cultures, including black, Japanese, Javanese, and South-Indian
Lascars. Just as the abeLungu identify their progenitors as having been white
castaways, the amaMolo identify theirs as ‘black’ castaways – it is thought that they
might have been Malagasy or Malay, but the general consensus is that they were
Indian (Crampton, 2004). Crampton (2004) chronicles an mPondo legend, which
describes the arrival of “long strange ships which anchored off shore, and at night had
sent a number of small boats with musket bearing men, in white headdresses and long
5
�flowing robes… much before the first Europeans.” The clan progenitors, Bhayi (the
son of Jafliti), and Pita, were said to have had “an Arab look about them, whose hair
was straight, long and black.”
Soga agrees with Kirby (1953) in that the name
“amaMolo” probably a derivation, brought about by the corruption of the word Moor
(pertaining to natives of North Africa). In Kalis’ interviews with extant amaMolo
members however, it was reported that the name comes from the traditional isiXhosa
greeting, Mholo, which was the only isiXhosa word that the castaways knew and which
they would repeat when asked ’from which clan do they originate?’ (Kalis, 2010,
personal communication with permission).
Another possible theory to their origins is that some Malabar slaves who had survived
the wreck of the Bennebroek, in 1713, had remained with the mPondo, instead of
trying to return to their own country or to search for civilization (Soga, 1930; Crampton,
2004). The story of the origin of the amaMolos, as retold to Soga by the Great Son of
the amaMolo Chief Mxhaka, is as follows: “Bhayi and his wife Nosali, Pita (his brother)
and another man, Mera were captured by white men and taken aboard a ship which
became wrecked, where they were washed ashore the coast of mPondoland." As
Bhayi’s wife was barren, he settled down at Brazen-Head, Mganzana; three kilometres
from where Bessie resided, and married an mPondo woman with whom he had five
children named Poto, Falteni, Mnyuri, Mngcolwana, Nyango and lastly Mgareni (some
of which are indicated in the partial pedigree - Figure 1.1).
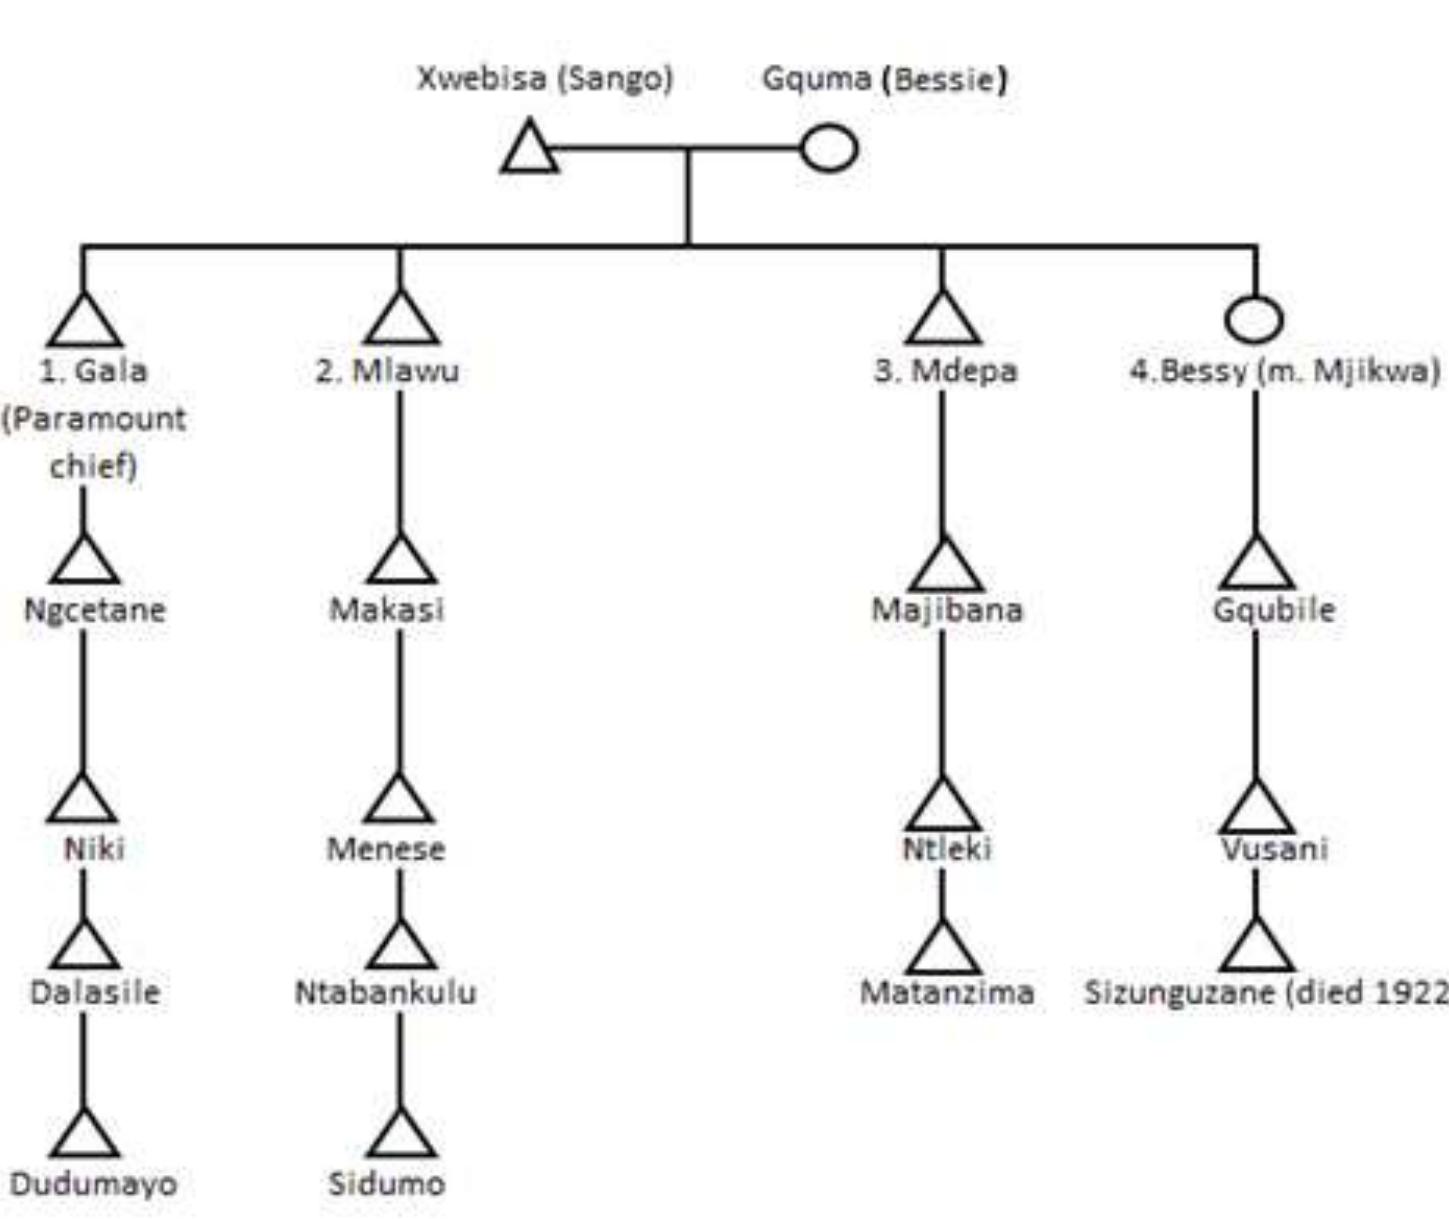
Figure 1.1. Partial pedigree of the amaMolo clan based on interviews with Chief of the amaMolo clan,
Mhlabunzima Mxhaka, by Janet Kalis, as part of her research (Kalis, 2009; personal communication). Two
primary branches indicate the relations of Bhayi, and his “brother”, Pita, who are the alleged sons of Jafiliti
(Soga, 1930; Crampton, 2004). Bhayi’s sons Poto, Falteni, Mnyuri, and Nyango also have been indicated.
Males are designated by triangle symbols and females are indicated by circles. The “=” indicates that these
are multiple wives of specific males.
6
�The well documented story of the wreck of the Grosvenor, tells of an English East
India Company (EIC) vessel, wrecked in 1782; this date corresponds well with the
presumed date of Bhayi’s arrival in mPondoland. Among its survivors were 25 Indian
seamen, including an Indian maidservant called Mary (possibly a version of Bhayi’s
fellow castaway Mera), accompanied by another Indian woman, Sally, whose name is
similar to Bhayi’s wife’s name, Nosali. The mystery of the Indian origins of the
amaMolo was seemingly resolved by a friend of Crampton, who, born and raised in
India, immediately recognized that the names were of Hindi origin. ‘Bhayi’, she said
comes from ‘bhay’ or ‘brother’ in Hindi. ‘Pita’ – with whom Bhayi was captured – means
‘father’, and ‘Poto’, the name of Bhayi’s eldest son is a corruption of ‘pota’, meaning
grandson.
Makuliwe, who has conducted research during the 1990s on Southern-Nguni clans,
states of the amaMolo clan that it “…can be traced back to white people that were
shipwrecked in the Indian Ocean and then married to Pondos”. This was echoed by
Chief Mxhaka and other contemporary clan members, interviewed by Kalis in 2010,
who
proclaim
that amaMolo
clan forebears
were
white
(Kalis,
personal
communication, 2010). Thus, 80 years ago when Soga did his research, amaMolo
were considered to be of Asian descent, but their recent cultural association is with
white or European forebears. Kalis has learned that contemporary members of the
amaMolo clan consider the clan name ‘abeLungu’ to be synonymous with ‘amaMolo’
and members of the abeLungu clan recognise those of amaMolo as patrilineal kin and
both account for one another in their oral histories. Exactly when and from where the
arrival of the amaMolo and abeLungu forebears on this continent had occurred, and
to what extent their origins are bound up with one another has not yet been
ascertained. Earlier accounts suggest that the amaMolo and abeLungu forebears had
survived the same wreck, and that Asian and European survivors subsequently went
their own ways, both assimilating into their own local communities, founding the
amaMolo and abeLungu clans, respectively (Soga, 1930; Kirby, 1953).
7
�1.1.4 Secondary clans and multiple castaway settlements
The abeLungu constitutes a broader super-clan family, incorporating numerous
lineages of clans which claim affiliation to non-African ancestry. The ‘primary’ clans
initiated by the original European and Asian castaways are the abeLungu Jekwa,
abeLungu Hatu, abeLungu Buku as well as the amaMolo clans. However, numerous
other clans exist within the abeLungu clan family. Multiple settlements and more recent
establishments of clans are believed to have originated from later shipwreck incidents
along the Eastern Cape’s Wild Coast, with survivors also having assimilated with local
Xhosa clans. As these founders were of non-African descent as well, they too had
founded their own independent abeLungu clans. This is supported by oral history as
well as the genealogies reconstructed thereof. The time-depths of the primary
abeLungu clan genealogies extend for ten generations on average until the common
non-African clan founder, while those of the more recently established clans go back
five generations on average (Kalis, 2009 – personal communication). A brief
description of clan families and subclans with hypothetical geographical regions of
origin is as follows: The founders of the original abeLungu clans Jekwa, Hatu and Buku
presumedly came from Western Europe (Britain and/or Ireland). The founders of
secondary abeLungu clans France, Horner, Irish, Caine, Ogle, Hastoni, Fuzwayo,
Sukwini and Thaka are believed to have also come from Western Europe
(England/Ireland) as well as Eurasia, while the amaMolo are believed to be of Eurasian
descent.
With regards to names of clans and clan-name prefixes used, Soga states “Etymology
as a science is unknown to the Bantu, and there are no phonetic rules laid down by
them. As a general rule the prefix is not a matter of choice, but it is subject to what we
may call dialectic phonetics. What, then, governs the selection of a clan or tribal prefix?
The answer is that the selection is governed purely by phonetic requirements. There
is no rule determining the use of any prefix attached to the tribal name but that which
suits the tongue. “It would be phonetically awkward to say for instance, aba-Xosa, or
aba-Huhu” (Soga, 1930). For all practical purposes, the naming of the descendants of
the clan progenitors, Jekwa, Buku and Hatu as well as secondary abeLungu clans
retain the clan family prefix ‘abeLungu’ while the descendants of Bhayi and Pita, are
referred to as the ‘amaMolo’.
8
�1.1.5 The clan system
The dynamics through which an individual is recognised as a member of a group are
a critical part of the mechanism to defining the identity of a person (Montinaro, 2016).
The clan, here defined as a group of households reporting a shared ancestry, refers
to an intermediate level distributed between lineages within the hierarchical structuring
of a given society (Montinaro, 2016). Clan membership signifies descent from a
common ancestor after whom the clan itself has been named (Preston-Whyte, 1974).
Clan membership in agnatic societies like that of the abeLungu, is determined by the
principles of patrilineal descent - meaning clan name passes exclusively through the
male line and is infringed upon in the case of illegitimacy. The abeLungu are a
patrilocal society, where historically, migration has been limited from these clan nodes
(Soga, 1930). Clan lalis (homesteads) are geographically situated for the most part,
where clan forebears had originated their clans. The abeLungu observe strict clanexogamy practices and so it is customary not to marry inside one’s own clan. Polygyny
is widespread and the degree of which depends on the wealth of the husband (Soga,
1930; Chaix, 2007; Sanchez-Faddev, 2013).
Although the Xhosa clans in the sample live in deeply rural contexts, amongst
traditional Xhosa people, and have adopted their customs and religious practices, they
retain an affiliation with the European culture to which their ancestors belonged, which
is expressed in various ways (Kalis’ interviews, 2009). All of Kalis’ male informants
were able to name their male antecedents right back to the man who gave his name to
their clan, even when this went much further back than three generations. This
genealogical information is publicly recited on ritual occasions. Through the recitation
of clan names (iziduko) as well as praise names and poetry (izibongo), the presence
of deceased patrilineal ancestors is invoked at important occasions which are often
organised with the primary intention of appealing to ancestral spirits and seeking their
appeasement. Maguliwe recites the nqulo (praise) of the amaMolo (Kalis, field
interviews, 2009), listing the main forefathers of the clan (Figure 1.2).
However, as has been witnessed, abeLungu clans claim a degree of independence in
terms of how both rituals and praises to ancestors are performed. Our translator
Qaqambile had asked an abeLungu Horner clan member of these discrepancies:
9
�Qaqambile: “You are of this nation with mixed blood living among indigenous
people who have their own ways of living.
How do you do it?”
Mlungisa: “Well that’s easy. We were born in Xhosaland and we are living
among Xhosas. We have customs and traditions but we don’t do our rituals
like the Xhosas. For example, when Xhosa people kill a goat they use a
spear but we just slaughter it with a knife and enjoy the meat, that’s it. We are
white people so we don’t perform rituals. We can even perform rituals with a
chicken rather than a goat. We are not governed by the strong traditions of
the true Xhosa people (2009-11-05 Mlungisi Horner).”
1.2
Molecular Anthropology
This study was initiated as a collaboration with Janet Hayward Kalis (University of
Mthatha), who had been conducting anthropological and genealogical research on 13
different clans in the Transkei-mPondoland region of the Eastern Cape. Kalis has
documented details of genealogical relations and ritualistic practices of sacrifice and
praise (izinqula) to clan ancestors of contemporary abeLungu clans, which differ from
traditional Xhosa people’s as they retain an affiliation with European and Eurasian
culture to which their ancestors belonged (Janet Kalis, 2010, personal communication
with permission).
The recent genealogical history of human populations is a complex mosaic formed by
individual migration, large-scale population movements, and other demographic
events. Reconstructing human history requires the collection of various narratives
from disciplines such as anthropology, archaeology, history, linguistic studies,
paleontology and climatology. In the absence of written history, oral history has
recorded the transmission of biographical and historical information, but it is proven
that it is subject to changes and distortion over time. Genealogical oral histories,
however, can now be tested through the application of genetic markers present in Y
chromosome and mitochondrial DNA (mtDNA), which shed light on anthropological
questions by documenting the similarities and differences between people in terms of
molecular characteristics which parallel anthropological historical events, thereby
providing a clearer understanding of the abeLungu’s origins, and ultimately
contributing to understanding humanity’s past history.
10
�Figure 1. 2. Nqulo (praise) to the ancestors of the amaMolo
11
�1.2.1 Patrilineal descent and Y chromosome DNA
As unique organisms, most of humanity carry a cultural marker of coancestry, a
surname (and similarly with clan names), which is a counterpart to the biological
marker of coancestry common to all organisms - DNA (King and Jobling, 2009 [a]).
Surnames (and clan names) have been shown to be specific to particular indigenous
populations and to show geographical specificity within regions. This property means
that they find wide application as convenient proxies for ethnic origin in healthcare as
well as epidemiological studies (Shriver and Kittles, 2004; King and Jobling, 2009 [a]).
However, analysis where surnames are combined with Y chromosomes has also
enabled them to be used in genetic studies of historical migrations and admixture (King
and Jobling, 2009 [b]). We may expect that a clan name should correlate with a type
of Y chromosome, which has been inherited from a shared paternal ancestor –
possibly even the clan name’s original founder.
Several features of Y chromosome DNA make it a suitable marker for investigating
population histories. The Y chromosome is inherited paternally, which coincides well
with the fact that clan name is also paternally inherited, making it a suitable marker for
delineating patrilineal ancestral lineages (Jobling, 2001; Shriver and Kittles, 2004).
Very little of the Y chromosome is made up of coding-DNA and as a result, markers in
the Non-Recombining region of the Y chromosome (NRY) are examined for insight
into patrilineal population history (Cann et al., 1987; Jobling and Tyler-Smith, 2003;
Ralph and Coop, 2013).
Formally, any combination of polymorphic markers along a non-recombining molecule,
and that tend to be inherited together constitute a haplotype [Jobling and Tyler-Smith,
2000; Y Chromosome Consortium (YCC), 2002]. Combinations of the biallelic markers
define stable lineages of Y chromosomes that we refer to as ‘haplogroups’; a
haplogroup describes haplotype groups which coalesce to a point where certain
coding-region Single Nucleotide Polymorphism (SNPs) are found in common, and
thus define a common ancestor, by having the same SNP in all haplotypes (Jobling
and Tyler-Smith, 2000; YCC, 2002). Hammer and Zegura (2002) define the term
haplogroup as ‘NRY lineages defined by binary polymorphisms’, whereas the term
haplotype is reserved ‘for all sub-lineages of haplogroups that are defined by variation
at STRs on the NRY’.
12
�The estimated average Y chromosome SNP mutation rate is approximately 10-7 to
10-8 per generation (Jorde et al., 1998; Gray et al., 2000). Thus the low mutation rate
of SNPs allows us to investigate pre-history of humans, but these polymorphisms are
relatively uninformative about recent history (Jorde et al., 1998; Gray et al., 2000).
Microsatellite short tandem repeats (STRs) can provide better information about
recent evolutionary events than that of slowly evolving SNPs, due to their high
mutation rate. The mutation rates of STRs are on average about 4 to 5 orders of
magnitude higher than that of SNPs, and approach 10-3 per generation which is high
enough to be directly determined in pedigree studies, spanning only a few generations
(Jorde et al., 1998). We can hope to identify genetic evidence of more recent
relatedness, and so obtain insight into the population history of the past tens of
generations ago (Forster et al., 2000; Zhivotovsky et al., 2004; Ralph and Coop, 2013).
1.2.2 Y chromosome haplogroups and phylogeographic variation
Lineage based ancestry tests are popular because NRY haplotypes can provide
information that is regionally specific. Y chromosome haplotypes act as barcodes or
profiles of individuals sharing common ancestry. These profiles constitute haplogroups
that phylogenetically represent charted human lineages, which are consistent with the
movement of modern-day humans out of Africa (Jorde et al., 2000; Quintana-Murci et
al., 2004; Barik et al., 2008). The Y Chromosome Consortium (YCC) and the
International Society of Genetic Genealogy (ISOGG) have published updated versions
of the maximum parsimonious phylogenetic tree of human Y chromosomes
accompanied with proposed universal nomenclature. The most recent phylogenetic
tree from consists of 311 haplogroups, which are defined by 600 SNPs (Geppert and
Roewer, 2012; ISOGG, 2016). The phylogeny maps marker SNPs which correlate to
the current global phylogeographic diversity of the Y chromosome (Hammer and
Zegura, 2002; YCC, 2002; ISOGG 2016; Jobling and Tyler-Smith, 2003). The major
clades (haplogroups) are labeled with a capital letter (e.g., R) and sub-haplogroups
are designated alternately with numbers and lower-case letters (e.g., R1b). Usually
the terminal SNP is included to determine the branch unequivocally (R-M343 alias
R1b) (Hammer and Zegura, 2002; Geppert and Roewer, 2012). For the purpose of
clarity, the combined SNP-marker/haplogroup-name nomenclature will be used when
discussing haplogroups (for example, R1b (R-M343)).
13
�Since Y chromosome haplogroup frequencies are highly structured by geography, it
is possible to distinguish between African and non-African Y chromosomes, and in
most instances, the combined haplogroup-haplotype information can reveal a
judicious indication of the ___location of the broader geographic region of the origin of the
Y chromosome (Hammer and Zegura, 2002; Shriver and Kittles, 2004; Naidoo et al.,
2010). Figure 1.3 has been adapted from Chiaroni et al., (2009) and illustrates the
prevalence and frequency distribution of Y chromosome macro-haplogroups globally.
Figure 1.3. Geographic distribution map of Y chromosome macro-haplogroups - adapted from
Chiaroni et al., (2009).
14
�Based on the anthropological and oral histories it is expected to observe
predominantly European Y chromosome haplogroups in the abeLungu clans and
Eurasian ancestral haplogroups in the amaMolo. The majority of lineages observed in
contemporary European and Eurasian populations fall into the following main
haplogroups, namely R, G, I, J and Q, and are defined by SNP markers M198 and
M343, M201, M170, M172 and M242 respectively (Jobling and Tyler-Smith, 2003;
Karafet et al., 2008; Chiaroni et al., 2009; Myres et al., 2011). The prevalence of
macro-haplogroups A, B and E which originate in, and are largely restricted to the
African continent, will invariably be observed in the sample on account of gene-flow,
admixture and non-patrilineal events (Jobling and Tyler-Smith, 2003; Karafet et al.,
2008; Chiaroni et al., 2009; Ralph and Coop, 2013).
1.2.2.1 European and Eurasian haplogroups
Typically, greater than 50% of men in Europe are affiliated with haplogroup R (Chiaroni
et al., 2009; Myres et al., 2011). Macro-haplogroup R is defined by marker M207 and
is the most common clade throughout north-western Eurasia, and the majority of
European Y chromosomes segregate under this haplogroup (Jobling and Tyler-Smith,
2003; Karafet et al., 2008; Chiaroni et al., 2009; Myres et al., 2011; Geppert and
Roewer, 2012). Haplogroup R accounts for more than one-third of Indian Y
chromosomes, and its daughter clades R1 and R2 are both found in tribal and caste
groups (Sahoo et al., 2006). Clade R1 splits into R1a and R1b, which are similarly
variable in Indians and western Asians but are less so in Estonians, Czechs, and
central Asians (Kivilsild et al., 2002). Lacau et al., (2012) showed that majority of
Afghan individuals (67.4%), segregate under R-M207 with sub-haplogroup R1a1aM198 variants present in both the North and South.
Haplogroup R1a1a (with its alternate name R-M198) is the dominant Y chromosome
lineage found in modern Eurasia, having originated in the Eurasian Steppes north of
the Black and Caspian Seas (Jobling and Tyler-Smith, 2003; Klyosov and Rozhanskii,
2012). R1a1a is particularly common in the large region extending from South
Asia and Southern Siberia, across India to Central and Eastern Europe (Slavic
populations) and Scandinavia (Sengupta et al., 2006; Underhill, 2010; Klyosov and
Rozhanskii, 2012). Even though haplogroup R1a occurs as the most frequent Y
chromosome haplogroup among populations such as Slavic, Indo-Iranian, Dravidian,
15
�Turkic and Finno-Ugric, many authors have interest in the link between R1a and the
Indo-European language family (Sengupta et al., 2006; Underhill, 2010). Haplogroup
R1a1 (R-M198) haplotypes were brought to India around 3500 years ago (Sengupta
et al., 2006). The present understanding is that R1a1 bearers, known later as the
Aryans, brought to India not only their haplotypes and the haplogroup, but also their
language, thereby building the linguistic and cultural bridge between India (and Iran)
and Europe, possibly creating the Indo-European family of languages (Sengupta et
al., 2006). This has relevance for the possible Indian roots of the Lascar slaves
believed to be the forefathers of the amaMolo clan, in that through discovering
Eurasian haplogroups it would support the oral history with regards to their nonAfrican, and possibly Indian origins.
Haplogroup R1b is believed to have originated and expanded as humans began to recolonize Europe after the last glacial maximum, approximately 10 to 12,000 years ago
(Myres et al., 2011). R1b is the most common haplogroup found in Western Europe
and is also found in Eastern European and West-Asian populations at lower
frequencies, and is also prevalent in the vast majority of the British Isles (Kivilsild et
al., 2002; Campbell, 2007; Karafet et al., 2008; Chiaroni et al., 2009; Myres et al.,
2011; Raghavan et al., 2014), and also in parts of sub-Saharan Central Africa, for
example around Chad and Cameroon (Balaresque et al., 2009). About one in five
males sampled in northwestern Ireland stems from an R1b-delineated haplogroup,
R1b3, and is linked via the patriline which descends from the most important dynasty
of early medieval Ireland, the Uı´Ne´ill (Moore et al., 2006; King and Jobling, 2009 [b]).
Other haplogroups which segregate under the Eurasian subcontinent include
haplogroup G-M201 which originated around 30,000 years ago, in either the Middle
East or South Asia (Cruciani et al., 2002; Cinniog˘lu et al., 2004; Karafet et al., 2008).
While haplogroup G (G-M201) occurs at its highest levels in the Caucasus region (e.g.
74% in Ossetians from Digora), it is widespread; occurring at low to moderate levels
from Northwest Europe to South and East Asia (Cinniog˘lu et al., 2004). Around 1 in
10 Ashkenazi Jewish males fall into haplogroup G (G-M201), and it is found at an
average frequency of 7.9% in the Afghan gene pool, established during the Neolithic
expansion throughout the region (Behar et al., 2004; Sengupta et al., 2006; Lacau
2012).
16
�Haplogroup I (I-M170) is considered as the only native European Haplogroup, and
appeared in Europe from the Middle East roughly 20,000 years ago and, alongside
haplogroup R, it is considered as the second major European haplogroup (Semino et
al., 2000; Hammer and Zegura, 2002). Haplogroup I (I-M170) Y chromosomes occur
in nearly 20% of the European male population, and has also been found among some
populations of the Near East, the Caucasus, Northeast Africa and Central Siberia
(Hammer and Zegura, 2002; Karafet et al., 2008).
Haplogroup J lineages are found at high frequencies in the Middle East, North Africa,
Europe, Central Asia, Pakistan, and India (Underhill et al., 2001; Semino et al., 2002;
Behar et al., 2004; Sengupta et al., 2006). Haplogroup J-M172 is the most common J
sub-haplogroup in Europe, which emerged 30,000 years ago in the Middle East and
has been carried by Middle Eastern traders into Europe, central Asia, India, and
Pakistan (Di Giacomo et al., 2004; Karafet et al., 2008). Haplogroup J-M267
predominates in the Middle East, North Africa, and Ethiopia (Semino et al., 2004),
which contains the Cohen Modal Haplotype (CMH). The CMH is found exclusive to a
lineage believed to have originated from the Cohanim (Jewish high priests) in the
northern portion of the Fertile Crescent, where it later spread throughout central Asia,
the Mediterranean, and south into India around 10,000 years ago (Hammer et al.,
2009; Soodyall, et al., 2013). The lineage eventually migrated south, back into Africa
and a variant of the modal haplotype features in the Lemba people. Soodyall, et al.,
(2013) publicised revised haplotype data on the Lemba peoples’ origins, which
through carrying the CMH, feature semitic origins in majority of haplogroups. The
name "Lemba" may originate from chilemba, a Swahili word for turbans worn by Bantu
peoples, or lembi, a Bantu word meaning "non-African" or "respected foreigner"
(Shimona, 2003).
Haplogroup Q is defined by marker Q-M242, and is the lineage that links Asia and the
Americas (Jobling and Tyler-Smith, 2003; Zegura et al., 2004). This lineage is believed
to have originated in southern/central Siberia and central Asia, migrated through the
Altai / Baikal region of northern Eurasia and across the Bering straits eventually into
the Americas, thereby characterising a novel founder Native American haplogroup
(Jobling and Tyler-Smith 2003; Bortolini et al., 2004; Zegura et al., 2004; Karafet et
al., 2008).
17
�1.2.2.2 African Y haplogroups
The frequently observed clinal pattern of reduced genetic diversity away from Africa is
seen as strong evidence for the out-of-Africa movement(s) of anatomically modern
humans approximately 35,000 and 89,000 years ago, where a minority of
contemporary East Africans and Khoisan represent the descendants of these most
ancient ancestral patrilines (Underhill et al., 2000; Soares et al., 2011; SanchezFaddev, 2013). Haplogroups A and B are the deepest branches in the Y chromosome
phylogeny and are essentially restricted to Africa, providing the evidence that modern
humans first arose there (Underhill et al., 2001; Jobling and Tyler-Smith, 2003; Karafet
et al., 2008; Chiaroni et al., 2009). Macro-haplogroup A is not mono-phyletic and
contains many sub-clades (Karafet et al., 2008). It is mainly restricted to the Rift Valley
from the Cape up to Ethiopia, to mostly, but not exclusively some of the oldest huntergatherers who still survive and speak Khoikhoi and San languages, which are believed
to be the oldest human languages represented by haplogroup A00 (Underhill et al.,
2001; Cruciani et al., 2002; Salas et al., 2002; Karafet et al., 2008). The interruption of
its distribution in the middle of the Rift Valley is possibly due to replacement by Bantuspeaking farmers who settled the region starting in the first millennium of the Christian
era (Chiaroni et al., 2009).
Haplogroup B is found mainly among African Pygmies of the central African forest who
are still predominantly hunters-gatherers but speak Bantu languages borrowed from
farmers who arrived in the area between 2,000 and 3,000 years ago (Underhill et al.,
2001; Karafet et al., 2008). Haplogroup B (B-M152) occurs at low to moderate
frequencies in most sub-Saharan African populations, including populations from
Cameroon and East Africa, and among Southern Bantu-speakers (Cruciani et al.,
2002; Underhill et al., 2001).
Haplogroup E1b1a (E-M2) is the most common haplogroup in sub-Saharan Africa
which originated in Northeast Africa between 30,000 to 40,000 years ago (Hammer
and Zegura, 2002; Crucianci et al., 2002). Today its lineages are found occurring in
the Mediterranean and the Near East (Cruciani et al., 2002; Karafet et al., 2008).
Settlement outside of Africa by haplogroup E members involves the later
subhaplogroup E-M35 varieties like M78, M81, and M123 that extended to Arabia and
the northern Mediterranean coast (Cruciani et al., 2002; Chiaroni et al., 2009).
18
�Haplogroup E2b1 (E-M85) is seen throughout sub-Saharan Africa at moderate levels
and is a haplogroup that diversified some time afterward other haplogroup
sublineages, probably having descended from the East African population that
generated the Out-of-Africa expansion (Cruciani et al., 2002). Haplogroup
E1b1a1a1c1a (E-M191) most likely spread throughout sub-Saharan Africa as a result
of migrations associated with the Bantu Expansion. It is now the most common
haplogroup in sub-Saharan Africa, although, its highest levels are still seen in West
Africa (Cruciani et al., 2002).
1.2.3 Y chromosome Short Tandem Repeats (Y-STRs) and Y-haplotypes
Previous population-ancestry type studies have shown the utility of STR haplotypes in
pedigree analyses, which include King and Jobling (2009 [b]), Wu et al., (2010),
Balanovsky et al., (2011), Reguiero et al., (2012), Soodyall (2013) and Westen et al.,
(2015).
Y chromosome data is organized such that haplogroups provide an indication of
geographic clustering and haplotypes further refine variation within haplogroups. YSTR haplotypes are used to predict haplogroups which directs the sequence of
multiplexes for Single Base Extension (SBE) - SNP affirmation. The use of SNP
haplogroup data in conjunction with STR haplotype data creates extended haplotypes
which allows for the measure of unique transmissions in the pedigree, and permits the
examination of relationships between haplotypes in haplogroup-specific Y-haplotype
networks.
1.3 Matrilineal ancestry
1.3.1 Mitochondrial DNA
Mitochondrial DNA (mtDNA) has proved to be a powerful tool in reconstructing
population history and diversity studies (Richards et al., 2000; Finnila et al., 2001;
Fadhlaoui-Zid et al., 2004; Ralph and Coop, 2013). MtDNA is present in the
mitochondrion organelle of the cell which are usually numerous and polymorphic in
morphology. The mitochondria are involved with energy manufacture and processing
of the cell, where most mitochondrial genomes encode for 13 subunits of the oxidative
phosphorylation system, two ribosomal RNAs (rRNAs), and 22 transfer RNAs (tRNAs)
(Figure 1.4) (Scheffler, 2000; Iborra et al., 2004; Doosti and Dehkordi, 2011). Genetic
19
�analysis of mtDNA has been an important tool in understanding human evolution due
to the characteristics of mtDNA, such as its high copy number, near-absence of
recombination, high substitution rate, as well as its maternal mode of inheritance
(Cann et al., 1987; Scheffler, 2000; Destro-Bisol et al., 2004; Iborra et al., 2004; Behar
et al., 2007; Gonder et al., 2007). Knowledge of mtDNA sequence variation is rapidly
accumulating, and the field of anthropological genetics, which initially made use of
only the first hypervariable segment (HVS-I) of mtDNA, is advancing to the point where
complete mtDNA genome analysis will be the common genotyping practice (Salas et
al., 2002; Kivisild et al., 2004; Behar et al., 2007; Gonder et al., 2007). Most studies of
human evolution include mtDNA sequences from the 1kb, non-coding control region
known as the displacement loop or ‘d-loop’, which occupies less than 7% of the mtDNA
genome (Scheffler, 2000; Iborra et al., 2004; Gonder et al., 2007) (Figure 1.4;
adapated from “the Mito Blog” online blog). Mutations within the hypervariable regions
I and II (situated within this 1kb non-coding region) act as highly informative marker
loci for delineating mitochondrial ancestry (Scheffler, 2000; Gonder et al., 2007;
Schlebush et al., 2009). Clusters of HVR mutations delineate haplogroups, which are
represented as the major branch points on the mitochondrial phylogenetic tree. The
Phylotree mtDNA tree (Build_16) provides a phylogenetic tree of global human
mitochondrial DNA variation, based on both coding- and control-region mutations, and
includes haplogroup nomenclature as defined by its developers, van Oven and Kayser
(2009). The phylogenetic tree is updated regularly to incorporate information from
novel mitochondrial genome sequences and was last updated on the 19 February of
2014.
20
�Figure 1.4. Schematic overview of the mitochondrial DNA molecule. HVRI & HVRII as situated in
the D-Loop or control region of the mitochondrial DNA molecule, amidst other primary
mitochondrial coding genes. Numbers indicate positions of DNA base pairs. Adapted from the
“MitoBlog” online blog.
1.3.2 mtDNA phylogeographic variation and inferring matrilines
Without a cultural marker such as clan name which can be used to confer the
patrilines, the strict patrilineal inheritance of the amaXhosa clan name means that it
would be difficult to trace the lineages of abeLungu women. However, mitochondrial
genotyping also shows strong geographic structuring and will allow us to infer the
phylogeographic landscape of the maternal lines. It will reveal traces of non-African
ancestry found in the matrilines, having possibly derived from Bessie (whose maternal
legacy is the most historically renowned), or of any other female surviving members.
Given the historic nature of the abeLungu, descendants of non-African female
survivors may harbour possible European and/or Eurasian origins which could be
observed in the mtDNA of these lineages. Several historians including Soga (1930),
Crampton (2004) and Kirby (1953) are in agreement that the oral history states that
the non-African survivors from shipwrecks were predominantly male individuals, who
had integrated into Xhosa communities and married local Xhosa women with whom
21
�they began clan families of mixed ethnicities. From this tenet we may expect to
observe a majority of African haplogroups in the maternal lineages, if not entirely.
The study of the geographic distribution and diversity of genetic variation is known as
the “phylogeographic approach” (King and Jobling, 2009). The global distribution of
mitochondrial haplogroups is such that Eurasia, Asia, Europe and the Americas all
retain haplogroup diversity signatures which reflect the migration of anatomically
modern humans out of Africa into the Near East, approximately 100 to 130 000 years
ago (Behar et al., 2008; Soares et al., 2011). Mitochondrial DNA diversity, in Africa,
can be assigned into seven macro-haplogroups (L0 to L6), with haplogroups L0–L3
and L5 as the primary mtDNA haplogroups whose spread is restricted mainly to subSaharan Africa (Kivilsild et al., 2004; Loogvali et al., 2004; Behar et al., 2008) with the
rest of the worlds’ lineages classified as subgroups of macrohaplogroups M, N and R
(Behar et al., 2008; Soodyall and Schlebusch, 2010). A world map illustrating the
global distribution of mtDNA haplogroups has been adapted from that found on the
J.D MacDonald family name reference database (Figure 1.5).
Figure 1.5. Global distribution map of mtDNA haplogroups, adapted from MacDonald
(2005). The map illustrates the global distribution of mtDNA haplogroups partitioned by
ethnic groups across the globe
22
�1.3.2.1 African mitochondrial haplogroups
Macro-haplogroup L is geographically restricted to sub-Saharan Africa and has been
divided into haplogroups L0–L6 (Salas et al., 2002; Behar et al., 2008). Haplogroup
L0 is divided into sub-haplogroups L0a, L0d, L0f, and L0k, and the time to the most
recent common ancestor (TMRCA) of L0k, L0f, and L0a is 139.8 ± 24.6 kya (Gonder
et al., 2007). L0a is believed to have originated in eastern Africa and is the largest,
most diverse and widespread haplogroup of the L0’s. L0a common in eastern, central,
and southeastern Africa, but is almost absent in northern, western, and southern
Africa. Haplogroup L0a was probably brought to south-eastern Africa by the eastern
movement of the Bantu Expansion (Salas et al., 2002; Plaza et al., 2004). L0d is
thought to be the oldest of the L0 clans. The distribution of L0d and L0k strongly point
to an origin of these haplogroups among Khoe-San ancestors, which occurred prior to
the arrival of Bantu-speaking populations in southern Africa. The frequencies of these
clades are of up to 40% in different south-eastern Bantu-speaking tribes (Schlebusch
et al., 2009). Haplogroup L0d is present in the !Xun and Khwe peoples at frequencies
of 51% and 16%, respectively, while L0k was found at frequencies of 26% in the !Xun
and 23% in the Khwe (Salas et al., 2002; Schlebusch et al., 2009). Haplogroup L0f is
a rare group, scattered throughout populations from East Africa to South Africa, and
is most common in Kenya, Sudan, Tanzania, and Uganda (Gonder et al., 2007).
Macro-haplogroup L1 encompasses 52% of the haplogroup L haplotypes and 29% of
all African mtDNAs according to a study by Wallace et al., (1999), and is comprised of
sub-haplogroups L1a, L1b and L1c (Gonder et al., 2007). Salas et al., (2002) stipulate
that haplogroup L1a was most likely to have been brought to south-eastern Africa by
the eastern stream of the Bantu expansion, after having been picked up in East Africa.
Haplogroup L1b is concentrated in western Africa, but it also occurs in central and
northern Africa (particularly in areas adjacent, geographically, connected by the West
African coastal pathway) but prevalent little in East, southeastern, or southern Africa
(Salas et al., 2002; Gonder et al., 2007). Haplogroup L1c is the largest and most
diverse group in the L1 clan, and most likely arose in Central Africa, around 20,000
years ago. Haplogroup L1c is seen at high levels in Central Africa, and is also found
commonly in African Americans and central African Bantu speakers (Salas et al.,
2002). The origin of L1c can be placed somewhere in Central Africa towards the
23
�Atlantic west coast, in the uncharacterized areas of Angola and the Congo delta, to
the south of the putative Bantu home-land, on the route of the “western stream” of the
Bantu expansion (Salas et al., 2002). Both L1b and L1c are nearly absent in eastern
and southern Africa (Gonder et al., 2007).
Haplogroup L2 is commonly subdivided into four main subclades, L2a through L2d
with haplogroup L2a as the most frequent and widespread haplogroup in Africa (Salas
et al., 2002). L2a appears to have arisen in West Africa around 33,000 years ago
before drastically increasing in number in south-eastern Africa, with the distribution of
haplogroup L2a possibly being a signature of the Bantu Expansion (Torroni et al.,
2001; Salas et al., 2002). Haplogroups L2b, L2c, and L2d appear to be largely confined
to West and western Central Africa Haplogroup L2c is frequent in western Africa, and
is rarely found in other parts of Africa (Salas et al., 2002). L2d being the oldest of the
L2 haplogroups is thought to have originated in West Africa and is found in most
western and central African populations, declining in frequency toward the south
(Salas et al., 2002).
Haplogroup L3e is the most widespread, frequent, and ancient of the African L3
clades, comprising approximately one-third of all L3 types in sub-Saharan Africa and
possibly arose in Central Africa near Sudan around 35,000 years ago (Bandelt et al.,
2001; Soares et al., 2011). Haplogroup L3d is found mainly in West Africa and was
found at high frequencies among southwestern Bantu speakers (Schlebusch et al.,
2009). It is said to have been brought into southern Africa with the western movement
of the Bantu Expansion (Bandelt et al., 2001; Soares et al., 2011).
Haplogroup L4 is common in East Africa and the Horn of Africa, and is prevalent in
North-eastern African populations, while less prevalent in central Africa (Batai et al.,
2013). It is found at low frequency or almost absent in southern African populations.
The highest frequencies are in Tanzania among the Hadza at 60-83%, and in the
Sandawe at 48% (Tishkoff et al., 2007).
Haplogroup L5 (previously referred to as L1e) has been observed at low frequency in
eastern Africa (Salas et al., 2002; Kivilsid et al., 2004), Egypt, and among the Mbuti
Pygmies (Kivisild et al., 2004; Gonder et al., 2007). The geographic spread of
24
�haplogroup L5b lineages is more southern, extending to the Sukuma from Tanzania
(Knight et al., 2003; Kivisild et al., 2004; Gonder et al., 2007).
An East African origin of haplogroup L6 seems most likely, because of its presence in
Ethiopians and the fact that its sister haplogroups L2, L3, and L4 are all diverse and
frequent there (Kivilsid et al., 2004). This is confirmed in a study on African origins in
the Arabian Peninsula, where haplogroup L6 had been observed most frequently
in populations of Yemen and Ethiopia (Abu-amero et al., 2007). Due to a lack of an
exact match from the African database for Southern-Arabian L6 samples, and the
relatively deep time-depth of its variation in Ethiopians and Yemenis—taken together,
at approximately 36,600 years ago, it is possible that this haplogroup has been
preserved in isolation in the Ethiopian Highlands and southern Arabia for tens of
thousands of years (Kivilsid et al., 2004; Abu-amero et al., 2007). However, the most
frequent haplotype of L6 in Yemenis does not bear any descendant lineages, which
suggests that its carriers coalesce to a common ancestor which occurs within only a
couple of thousands of years (Kivilsid et al., 2004; Abu-amero et al., 2007).
1.3.2.2 Non-African mtDNA haplogroups
Possible non-African mtDNA haplogroups which may be observed are those which
the oral history accounts for and would presumably be those found in Western Europe.
Analysis of diversity in European mtDNA reveals a relatively homogeneous landscape
comprised of approximately 10 haplogroups (Torroni et al., 1996; Rosser et al., 2000;
Loogvali et al., 2004).
Bryan Sykes in his seminal work, entitled “The seven daughters of Eve”, assigned
haplogroup names which classify the seven major mitochondrial lineages for modern
Europeans which trace back along the maternal lineages, to seven prehistoric women,
each stemming from the African Mitochondrial Eve, the most recent common maternal
ancestor (Sykes, 2001). Loogvali et al., (2004) re-mapped European and western
Eurasian haplogroups as those including haplogroups H, J, K, N1, T, U4, U5, V, X and
W. The study by Torroni et al., (1994[a]) and then that of Finnila et al., (2001), had
identified four European clusters (H, I, J, and K) individuals of European ancestry.
Torroni et al., (1996) applied the same methodology to two Scandinavian population
samples which identified five additional clusters (T, U, V, W, and X), which, together
25
�with the previous four clusters, appeared to encompass virtually all examined
European mtDNAs (Torroni et al., 1996; Macaulay et al., 1999; Simoni et al., 2000; Fu
et al., 2012). Haplogroup H alone constitutes about one half of the European mtDNA
pool and is widespread also in western Asia (Simoni et al., 2000; Loogvali et al., 2004;
Brotherton et al., 2013). The United Kingdom is comprised of 44.7% Eurasian
haplogroup H, which is predominant in Western Europe, and is found distributed
amidst the Iberian Peninsula, found in Spain at 27.8%, Morocco (19.2%) and Sardinia
in 17.9% of mtDNAs (Achilli et al., 2004). Haplogroup U is represented by its subclades
U1a, U3, U5, U5a1a, U7a, and K which are predominant in the Near East and Europe
(Macaulay et al., 1999; Richards et al., 2000; Fadhlaoui-Zid et al., 2004). Haplogroup
V, which is largely distributed in Western Mediterranean populations most likely
originated within Europe and spread eastward (Richards et al., 2000; Fadhlaoui-Zid et
al., 2004).
26
�1.4 Aims and objectives of the study
It has always been the case that unlike much written history, the oral transmission of
biographical and historical information cannot be verified as it is subject to change and
elaboration over time. In this study we address the issue of markers of identity from a
genetic perspective. The main focus of this research is to use molecular markers to
shed light on the history of the ancestry of the abeLungu clans (and amaMolo) from
the Wild Coast region to the Eastern Cape. More specifically,
i)
Y chromosome DNA data will be used to trace the geographic region(s)
of origin(s) of the male founders of the clans; male subjects are the focus
of the study because both matrilineal (mtDNA) and patrilineal (Y-DNA)
studies can be conducted on DNA from a single individual, and more
fundamentally because Y-DNA is inherited in tandem with the cultural
marker of clan name
ii)
MtDNA will be used to assess the maternal genetic contribution of
females in these groups. A corollary would be to determine any links to
Bessie and her maternal legacy
iii)
The genetic data will be used in conjunction with genealogical information
to test/refine the oral history of the abeLungu and the amaMolo, which
claims European/Eurasian paternal ancestry. In particular, I hope to see
whether, and to what extent, oral histories and genealogies that link
contemporary isiXhosa clans to non-African forebears have survived.
Given that Y chromosomes are transmitted from father to sons, like surnames (clans
in this instance), the Y chromosomes found in living people from the group ought to
coalesce within clans, to the founding father of the clan. Since the patterns of Y
chromosome variation show strong correlation with geography, this study will make
use of the global Y chromosome phylogeny to assess the geographic region of origin
of the founding fathers of the abeLungu and amaMolo clans. Also, Y chromosome
data would be used in conjunction with the revised genealogy would enable an
examination of the fidelity of Y chromosome transmission within clans.
27
�Similarly, the mtDNA data would resolve the ancestry of females who have contributed
to shaping the gene-pool of these clans. MtDNA data are also highly structured by
geography and African haplogroups can be distinguished from non-African ones.
28
�CHAPTER 2
Subjects and Methods
The following chart (Figure 2.1) presents an overview of the methods employed in the
study so as to resolve extended Y chromosome haplotypes and mtDNA haplogroups
of the paternal and maternal lineages of the abeLungu.
Figure 2.1. Schematic overview of the methods employed in the study
29
�2.1
Subjects and sampling
2.1.1 Ethics approval for study
This research has been approved by the Human Research Ethics Committee at the
University of the Witwatersrand under protocol numbers M090576 (previously
M980553) for Professor Himla Soodyall, and protocol number M120364 for David de
Veredicis (Appendix A). DNA was collected from research subjects with their informed
consent, following the appropriate ethical guidelines for research on human subjects
by the NHLS.
2.1.2 Sampling and research area
The sample set comprised of 198 subjects which consisted of 188 males and ten
females. Of the 188 males, 146 self-identified into one of 13 abeLungu clans. The
remaining 42 individuals were not affiliated with any of the abeLungu clans, but were
included in the study to represent males from regions co-habited with the abeLungu.
These subjects self-identified as ‘Xhosa’, ‘mixed’ race, or were unsure of their
ancestral background. Since the primary focus of the study revolves around the
patrilineal heritage of the abeLungu, the ten females (who were relatives of principal
male subjects), have been included for mtDNA studies. The inclusion criterion was to
sample at least one male from each compound in the village, two males were preferred
where available, and closely related individuals such as father–son pairs were
randomly included. Present-day abeLungu subjects resemble their Xhosa relatives
phenotypically for the most part, however some have retained recessive features that
they inherited from their European/Eurasian roots. Three subjects, including an
individual named “Lord Nicholas Beresford” of the clan Irish, were found to still retain
blue eyes (Figure 2.2).
30
�Figure 2.2. Photographs of three male subjects featuring blue eyes which illustrate the
phenotypic links to their non-African patrilineal ancestry. Photographs have been taken
with the individuals’ permission; Mamolweni, Eastern Cape, 2009, 2010.
The research area spanned about 150 km of coastal region closely associated with
locations of shipwrecks which were found between the Mzimvubu and Xhora rivers
(Figure 2.3). In her fieldwork, Kalis had interviewed 13 abeLungu clans located in 24
homesteads or lalis (Table 2.1), all of which fall under the greater ‘abeLungu’ clan
superfamily. However, it is only the amaMolo, abeLungu Jekwa, abeLungu Hatu and
abeLungu Buku clans whose genealogies trace descent from their forebears of the
original shipwreck survivors of the 16th and 17th century, as documented by Soga in
1930, and are considered as the primary abeLungu clans. The secondary, more
recently established abeLungu clans include the clans Caine, France, Horner, Irish,
Ogle, Hastoni, Sukwini, Fuzwayo, and Thakha (Table 2.1) which have from more
recent origins from non-African shipwreck survivors having assimilated into the
mPondo people. Individuals from these clans were genotyped for the purpose of
elucidating their Y chromosomes origins as well, and were sampled from homesteads
near those of the three primary abeLungu clans (Buku, Hatu and Jekwa) and the
amaMolo. The geographic sampling locations of both primary and secondary
abeLungu clans as well as the amaMolo can be found summarized in Table 2.1 and
indicated in Figure 2.3.
31
�Community engagement began by first visiting the amaMolo Chief Mhlabunzima
Mxhaka residing at ‘the Great Place at Mamolweni’ in mPondoland, so as to gain
endorsement for the study and introduction to people in this region. The Chief also
pointed out that even though his people identify through the amaMolo clan name they
are also known as abeLungu. This was the first indication that what had been read
about in documented history about the amaMolo being an independent clan was not
necessarily reflected in the field. Having obtained approval from the Chief, other
members of the abeLungu were engaged with from whom clan family histories were
collected. The research was facilitated by our interpreter Mr. Qaqambile Godlo, who
enabled translations between English and isiXhosa. Most subjects were able to name
their male antecedents back to their clan progenitor. The genealogies of clan
representatives were constructed from oral histories and kinship data collected by
Kalis, and are located in Appendix C, under Figures S1 – S6.
32
�Table 2.1. Geographic sampling regions of abeLungu clans
33
�Figure 2.3. Research area of the study. Depicted are the locations of lalis, or homesteads of the three
primary abeLungu clans, namely abeLungu Jekwa, Buku, Hatu as well as the amaMolo. The research
area is located between the Xhora and Mzimvubu rivers, as situated along the Wild Coast, in the
Eastern Cape of South Africa. This distribution can be found under Table 1. This map has been adapted
from Google Maps online service: Imagery @2013 TerraMetrics, Map data @2013 AfriGis (Pty) Ltd.
Google Maps
34
�2.2. Laboratory Methods
2.2.1 DNA extraction and quantification
Buccal swabs were taken using sterile cytology brushes from Gentra Puregene®
Buccal Cell Kits (Qiagen, Germany). Swab heads were placed in labelled 2.0 ml
Eppendorf tubes containing 300µl Cell Lysis Solution (Puregene® Kit). Two brush
swabs (an A and B sample) were taken per individual, in the event of the contamination
the first sample or simply if there was not enough DNA of the first sample to fully
resolve the subject’s ancestry genotype. DNA extraction was performed on cheek cells
collected by using Puregene® DNA purification kits (Qiagen, Germany) according to
the product manufacturer’s instructions. The basic principles of this method of DNA
extraction involve the lysis of the cell membrane, degradation of proteins and the final
precipitation of DNA out of solution. Nucleic acid concentrations were quantified using
a NanoDrop® ND-1000 Spectrophotometer and ND-1000 v2.2.0 software (ThermoFisher Scientific Inc.). Absorbance values were measured at a wavelength of 260nm.
Once extracted, stock DNA was diluted with ddH20 into the required working
concentrations for the various genotyping processes (20ng/μl, 5ng/μl and 1 ng/μl).
2.2.2
Molecular methods for Y chromosome DNA studies
All methods for mtDNA and Y chromosome DNA screening have been developed and
optimised within the Human Genomic Disease and Diversity Research Laboratory
(HGDDRL). A combination SNP-STR method of genotyping Y chromosome DNA had
been employed for the purpose of examining Y chromosomes both at the haplogroup
level, and at the more resolved haplotype level. These include resolving haplogroupdefining Y chromosome SNPs by using several Single Base Extension (SBE) assays,
as described by Naidoo et al., (2010), and secondly through examining STR variation
using microsatellite loci. When using combination SNP-STR systems, one acquires
an improved resolution of the landscape of geographic origins as well as improved
precision and accuracy of divergence time estimates (Zhivotovsky et al., 2004;
Ramakrishnan and Mountain, 2004; Klyosov, 2009; Naidoo et al., 2010).
35
�2.2.2.1 Y-STR genotyping
STR genotyping was performed using the AmpFℓSTR® Yfiler™ PCR Amplification Kit
(Life Technologies) according to the manufacturer protocol. The AmpFℓSTR® Yfiler™
assay is a multiplex which permits the simultaneous analysis of 17 STR loci in a single
PCR amplification, allowing for increased discrimination capacity of haplotype
analysis. The kit contains markers for the Y-STR ‘minimal haplotype' (minHt) which
encompasses the marker panel recommended by the Scientific Working Group on
DNA Analysis Methods (SWGDAM). The panel includes the Y-STR markers: DYS19,
DYS385a/b, DYS389I/II, DYS390, DYS391, DYS392, and DYS393. In addition to the
panel, markers for the highly polymorphic loci DYS438, DYS439, DYS427, DYS448,
DYS456, DYS458, DYS625 (Y GATA C4), and Y GATA H4 are included so as to
increase the resolution capacity to that of a suite of 17 microsatellite loci (Ayub et al.,
2000; Redd et al., 2002, Mulero et al., 2006; AmpFℓSTR® YFiler™ user guide). STR
screening using the STR Yfiler Kit System begins with the initial PCR amplification
step, with the reagents used, listed in Table 2.2.
Table 2.2. Amplification of Y-STR loci
PCR reagents
Final Volume (µl)
DNA sample (1ng/µl)
1.00
AmpflSTR Yfiler PCR reaction mix
2.30
AmpflSTR Yfiler Primer set
1.25
AmpliTaq Gold® DNA polymerase
0.20
ddH2O
1.50
The Y-STR amplification PCR Thermal Cycler (9700) conditions were: An initial
denaturation step of 11 minutes at 95°C, followed by 30 cycles of denaturation at 94°C
for one minute, annealing at 61°C and a ligation and extension at 72°C for one minute.
Lastly a final extension step at 60°C for 80 minutes occurs preceding the final cooling
and holding step which brings the temperature to rest at 4°C. PCR products were
visualized by suspending one microliter of PCR product together with 0.3µl internal
lane standard (GS500 LIZ) (Life Technologies) in 8.7µl Hi-Di® Formamide, before
36
�being analyzed on a 3130xl Genetic Analyzer (Life Technologies), and subsequently
visualized using Genemapper® ID Software v3.2 (Life technologies).
2.2.2.2 Y chromosome binary marker screening
Single base extension (SBE), is a fluorescence-based multiplex PCR system that
allows for numerous ancestry informative SNPs to be typed in a single reaction (Gray,
2000; Schlebusch et al., 2009). The principle of the SBE method lies behind the
extension of a “detection” primer (which vary through the attachment of varying sized
polynucleotide tail) and has annealed immediately upstream to the 5’ of the mutation
site, using one of four fluorescently-labelled dideoxynucleotide-triphosphates
(ddNTPs), with a fifth colour (LIZ 120) used as the internal lane standard. Naidoo et
al., (2010), developed seven SBE assay multiplex panels which resolve Y
chromosomes to one of 61 terminal haplogroup branches, where six panels focus on
resolving markers delineating subclades of African haplogroups A, B and E. All
samples were initially run with the YSNP1 panel (as they had presumably European
or Eurasian ancestry) and subsequent SBE multiplexes were performed hierarchically,
following the phylogenetic placement and allelic states of resolved polymorphisms on
the Y chromosome SNP phylogeny [Figure 2.4(a)] (YCC, 2002; Jobling and TylerSmith, 2003; Karafet et al., 2008; Schlebusch et al., 2009; Geppert and Roewer,
2012). Haplogroup nomenclature is in accordance with the most current International
Society of Genetic Genealogy (ISOGG) standard; when last accessed in November,
2016 and topology of the phylogeny is based on that of Karafet et al., (2008). The
YSNP1 marker panel was used for resolving European and Eurasian haplogroups,
and included primers for the binary markers SRY1083.1, M168, M89, M201, M69,
M170, M172, M9, M207, M198 and M343 [Figure 2.4(b)]. Samples which were found
to be ancestral at marker SRY 1083.1 and M91 were run using the using HG-A and
HG-B SBE assays. The SNPs used in the various mini-sequencing panels are listed
under Appendix B, Table S1, where haplogroup nomenclature is also in accordance
with the most current ISOGG, 2016 nomenclature. The ancestral and derived states
of markers as they appear on electropherogram profiles of YSNP1 assays are
illustrated in Figure 2.4(b). The ABI PRISM® SNaPshotTM Multiplex Kit (Life
Technologies) was used for all SBE assays, according to the manufacturer’s protocol
37
�with modifications on methods established by Naidoo et al., (2010). PCRs were
conducted using GeneAmp® PCR System 9700 Thermal Cyclers (Life Technologies).
Figure 2.4 (a) The Y chromosome SNP phylogeny with topology adapted from Karafet et al., (2008)
and nomenclature based on the ISOGG Y-DNA Haplogroup Tree (2016), illustrating the Y haplogroups
which are designated by specifc SNP markers screened for using the SNaPshotTM SBE method, as
well as the multiplex II assay. Newer branches of haplogroup A (A0 and A00), more recently defined
by ISOGG (2015) have not been indicated on the phylogeny (b) An electropherogram showing the
relative peak height, position and colour of peaks illustrating the derived states of the Y-STR markers
screened for when using the YSNP1 SBE marker panel
38
�Products were separated on an ABI PRISM® 3130xl Genetic Analyzer (Life
technologies) and data was visualized using GeneMapperID v3.2 software (Life
technologies). The reagents used for the YSNP1 multiplex PCR are listed in Table 2.3.
Table 2.3. YSNP1 SBE multiplex PCR reagents
PCR reagents
Final Volume (µl)
FastStart 10x Buffer (with MgCl2)
2.5
MgCl2 (25 mM) [2.5 mM]
2
dNTPs
3
YSNP1 Forward Primer Mix
1
YSNP1 Reverse Primer Mix
1
ddH20
14.3
FastStart Taq
0.2
Total
24.0
The PCR conditions used for the YSNP1 multiplex PCR are listed in Table 2.4.
Table 2.4. SBE PCR thermal cycler conditions
Temperature
Phase
Time (minutes)
95°C
Initial Denaturation
6:00
95°C
Denaturation
00:30
54°C
Annealing
00:30
72°C
Ligation and extension
00:30
72°C
Final extension
10:00
25°C
Hold
∞
35 cycles
39
�Excess PCR primers and dNTPs were removed via enzymatic purification. For every
5µl PCR product, 2µl of purification mix (see constituents in Table 2.5) was added
which was incubated at 37°C for 1 hour. Enzyme inactivation was at 75°C for 15min.
Table 2.5. Post-PCR purification reaction reagents
Reagents
Volumes per reaction (µl)
Shrimp Alkaline Phosphatase (1U/µl)
1.4
Exonuclease I (20U/µl)
0.2
ddH20
2.4
Once PCR-product had been purified, the SBE reaction proceeded. In this step the
“detection” primers were extended by ddNTPs that are complementary to the SNPs of
interest, using the ABI Prism SNaPshot™ Multiplex kit (ABI Life Technologies). A
positive control and a negative control template were included in the assay. The PCR
protocol is made of 35 cycles of a 10 second denaturation step at 96˚C, followed by
annealing which occurs at 50˚C for 5 seconds and lastly the ligation and extension at
60˚C for 30 seconds. The reagents and their proportions as used in the SBE reaction
are listed below in Table 2.6.
Table 2.6. YSNP1 Multiplex SBE reaction
SBE mix
Volumes per reaction (µl)
SNaPshot™ Multiplex Ready Reaction Mix
1
YSNP1 SBE primer mix
1
ddH20
1.5
Total
3.5
Positive control
Negative control
Control DNA Template
1.5
~
SNaPshot™ Multiplex Ready Reaction Mix
1
1
Control Primer mix
1
1
ddH20
1.5
3
Total
5
5
40
�Post-Extension enzymatic purification was then performed so as to remove excess
dNTPs and reagents. For every 5µl of SBE product 2µl of post-extension mix
(comprising of 0.5µl SAP (1U/µl, 0.7µl 10X SAP buffer and 0.8µl ddH20) was added.
The mix was incubated at 37°C for 1 hour, and inactivation of the enzymes was done
at 75°C for 15 minutes. Detection of SNPs was performed by suspending 2.0µl of
cleaned SBE product in 7.5µl Hi-Di® Formamide (Life Technologies), together with
0.5µl of internal lane standard (GS120 LIZ), prior to running on the on a 3130xl Genetic
Analyzer (Life Technologies).
2.2.2.3 Additional marker screening
Additional ancestry informative SNPs and STR markers not covered in the Yfiler™
and SNaPshot™ systems were screened for using the Multiplex-II assay developed
in the HGDDRL. The additional SNP markers included in the Multiplex II assay were
M139, M17, M175, M186, M60 and M91, which screen for haplogroup clades A, B,
R1a1 as well as internal nodes within the Y chromosome phylogeny and can aid to
direct genotyping by indicating whether to exclude or include certain SNaPshot™
systems. The additional highly polymorphic Y-STRs included in the multiplex II assay
were DYS426 and DYS388 which also increased the resolution of haplotype profiles
to that of 19 STR markers.
The procedure for the Multiplex II PCR amplification entails suspending 1.0µl DNA
template at a concentration of 1ng/µL in 9.0µl True-Allele PCR Premix, together with
5.0µl primer mix, totaling to a 15.0µl reagent mix. The PCR protocol for the Multiplex
II PCR amplification is as follows: An initial denaturation is step is performed at 95°C
for 11 minutes. Thirty cycles of a three step process follow according to: a denaturation
step at 94°C for one minute; annealing at 61°C for one minute and ligation and
extension occur at 72°C for one minute. Lastly a final extension step occured at 60°C
for 80 minutes followed by a holding step at 4°C. PCR products were subsequently
prepared for analysis by suspending 1.0µl product in 8.5µl Hi-Di® Formamide (Life
Technologies), together with 0.5µl of internal lane standard (GS500 LIZ), prior to
running on the on a 3130xl Genetic Analyzer (Life Technologies). SNP and STR
profiles were visualized using GeneMapperID v3.2 software (Life technologies).
41
�The ABI Taqman® assay (Life Technologies) was used to screen for SNP marker
M242 in order to confirm the presence of haplogroup Q samples (predicted using
YSTR haplogroup prediction software), according to the manufacturer’s protocol, on a
7900HT Fast Real-Time PCR System (Life Technologies). The PCR to amplify the
haplogroup Q-M242 SNP loci was performed by suspending 5.0µl of DNA (5ng) in
2.5µl Taqman® Universal Master Mix together with 0.25µl primer mix, and finally
adding 1.25µl of ddH2O, totaling the reagent mix at 5.0µl per reaction. The conditions
for the Taqman® assay consisted of an initial denaturation step at 95°C for 11 minutes
followed by 30 cycles of denaturation at 94°C for one minute, annealing at 61°C for
one minute and extension and ligation at 72°C for one minute. A final extension
occured at 60°C for 80 minutes prior to the end hold at 4°C.
2.2.3 Mitochondrial DNA molecular methods
Two approaches have been used for examining mitochondrial DNA (mtDNA) variation.
Firstly, sequencing of mitochondrial hypervariable region (HVR) d-loop variant sites
was performed and secondly to confirm haplogroups, minisequencing of mtDNA
control region SNPs was performed according to the methods described in
Schlebusch et al., (2009).
2.2.3.1 Mitochondrial D-loop HVR sequencing
Mitochondrial D-loop HVR sequencing was performed according to ABI Prism Dye
Terminator cycle-sequencing protocols developed by Life technologies, in conjunction
with methods previously published by Vigilant et al., (1989) and Behar et al., (2007).
Determining sequence variation of the mtDNA hypervariable regions was
accomplished by firstly amplifying the 1kb D-loop segment containing both the HVRs
using primers 15876F and 639R (Table 2.7).
Table 2.7. Primer sequences for the mtDNA1kb D-loop PCR amplification
Primer name
Primer sequence (5’ – 3’)
15876F (forward)
TCA AAT GGG CCT GTC CTT GTA G
639R (reverse)
GGG TGA TGT GAG CCC GTC TA
42
�The 50μl reagent mix needed per reaction, for the mtDNA1kb D-loop PCR
amplification reaction included 3.0μl of DNA template (5ng/μl), 2.0μl of dNTPs (2.5
mM), 2.0μl of each primer (15876F and 639R), 0.2μl FastStart® Taq, and made up to
50.0μl with 35.8 μl ddH2O. Cycle sequencing of HVR I & II was performed both in the
forward and reverse direction to confirm sequence information with primers used listed
in Table 2.8. The conditions for the template fragment amplification consisted of an
initial denaturation step at 95°C, 35 cycles of a three-step process: i) cyclical
denaturation at 95°C for 30 seconds, ii) cyclical annealing at 55°C for 30 seconds, and
iii) two minutes of cyclical extension at 72°C, followed by a final extension step at 72°C
for 10 minutes and the final resting phase at 25°C.
The amplified fragment was resolved on a 2.0 % agarose gel with ethidium bromide
staining to check the presence and quality of PCR product using 1 X TBE buffer,
Bromophenol blue, Ficoll dye loading buffer and 1kb+ DNA ladder size standard
(Thermo Fisher Scientific). Each gel run included a negative and positive control as
well. Gels were run at 120V for 30 min and samples were visualized using the G-Box
and GeneSnap software (SynGene). After confirming the presence of DNA bands and
PCR product quality, products were then purified via enzymatic digestion to eliminate
excess ddNTPs and reagents, using 0.2μl exonuclease I (at a concentration of 20U/µl)
and 1.4μl shrimp alkaline phosphate (at a concentration of 1U/ µl), made up to 5.0µl
with ddH20.
Table 2.8. Primer sequences for HVR I & II cycle sequencing
Region
HVR I
HVR II
Primer
Sequence
15946 Forward
CAA GGA CAA ATC AGA GAA AA
132 Reverse
GAC AGA TAC TGC GAC ATA GG
L29 Forward
GGT CTA TCA CCC TAT TAA CCA C
H408 Reverse
CTG TTA AAA GTG CAT ACC GCC A
43
�The volumes per reaction of cycle sequencing reagents included 2.0μl amplified 1kbPCR template, 1.0μl Big Dye Primer Mix (containing ddNTPs, Mg2+, Taq polymerase),
1.0μl of each of the four primers Primer L15946 / L29 / H132 / H408 (at a conentration
of 3.3μM), lastly made up to 10μl with ddH2O. The cycle-sequencing conditions
consisted of an initial denaturation step at 96°C for one minute, 25 cycles of {cyclical
denaturation at 96°C for 10 seconds, cyclical annealing at 50°C for five seconds, and
four minutes of cyclical extension at 60°C}, followed by the final resting phase at 4°C.
Prior to the final sequencing analysis sequencing products were purified using vacuum
purification and filtration using Montage SEQ96 sequencing reaction cleanup plates
(Millipore). After purification sequencing products were resuspended in Hi-Di™
formamide and were resolved on an ABI PRISM® 3130xl Genetic Analyzer (Life
technologies). POP_7 polymer was used instead of the supplier’s recommended
POP_4 polymer as recommended by a Life Technologies product bulletin (Life
Technologies, P/N: 4267258). Sequence data was visualized using Sequencing
Analysis Software v5.2 (Life technologies) which converted raw sequence data into
base-sequence and electropherograms.
2.2.3.2 Mitochondrial SNaPshotTM Sequencing (MTSS)
MTSS is an SBE based method which acts to target one of 14 SNPs in the
mitochondrial genome, which resolves to one of ten major macro-haplogroups
corresponding to global mitochondrial variation (Schlebusch et al., 2009), represented
in the mtDNA SNP phylogeny (Figure 2.5). The minisequencing protocol allows for
distinction between seven African L mitochondrial macro-haplogroups and three nonAfrican macro-haplogroups, namely M, N and R. MTSS assays were performed using
the ABI PRISM® SNaPshotTM Multiplex Kit (Life Technologies) according to methods
established by Schlebusch et al., (2009). The methods are based on those employed
in Y chromosome SNP SBE screening using the ABI PRISM® SNaPshotTM Multiplex
system (see section 2.2.2.2 - Y chromosome binary marker screening).
44
�Figure 2.5. MtDNA SNP phylogeny, adapted from Schlebusch et al., (2009) with nomenclature
established by Behar et al., (2008) and van Oven and Kayser (2008). Positions of SNPs are
indicated and correspond to where they are found within the mtDNA molecule as illustrated in
Figure 1.4 above in section 1.3.1. Colours are as they appear as peaks on electropherograms,
which define ancestral or derived allelic states of the terminal SNP.
2.3 Data analysis
2.3.1 Y chromosome data analyses
Genemapper® ID Software v3.2 (ABI Life technologies) was used for visualisation of
STR allele peaks. Allelic variation was determined by measuring the size of STR peaks
which indicate the number of repeat copies of a specific locus. It is to be noted that
the DYS389 locus is composite in nature and contains phylogenetically informative as
well as fast-evolving regions that may obscure structure. To account for this, the peak
height value at locus DYS389I has been subtracted from DYS389II, to give the derived
value DYS389IIc which was further used in analyses (Moore et al., 2006; Roewer,
2009). The Whit Athey haplogroup predictor was used to determine haplogroups,
using Y-STR haplotype loci peak heights as input data. An ‘equal priors’ search
criterion was used so as to avoid geographic bias in predictions (Athey, 2005).
Haplogroups were confirmed using informative SNPs resolved in Y chromosome
SNaPshot™ SBE typing.
Extended haplotypes were generated when haplogroup SNPs were used in
conjunction with STR haplotype data. Modal haplotypes are those which appeared
45
�most frequently, and in most instances in the genealogies can be presumed to be the
profiles tracing back to the original founding haplotype. Alternatively, modal
haplotypes acquired the higher frequencies due to drift or rapid expansion. Throughout
the haplotype analysis, for haplotype names a nomenclature system was implemented
to retain the anonymity of research subjects. For example, the haplotype name
“R343_2” represents the second (“_2”) unique haplotype found in haplogroup R1b (RM343) samples. Extended haplotype names were superimposed onto clan
genealogies to examine the patrilineal transmission of Y chromosomes in the
abeLungu. Genealogies were constructed using information collated from interviews
with clan elders and clan members, as well as subjects’ consent form genealogical
information (Appendix C, Figures S1 – S6).
Additional data from ongoing projects in the HGDDRL, as well as published Y
chromosome data from Eurasian, sub-Saharan African populations, including South
African samples as well as samples from Near-African islands including the Maldives,
Zanzibar and Madagascar were included in the comparative data analyses. Data from
publications which have been used as comparative data include Cadenas et al.,
(2008), Varzari et al., (2013), Roewer et al., (2008) and Jarve et al., (2009). For
haplogroup R1a1a segregating haplotypes comparative data was obtained from
Nebel, (2001), Qamar et al., (2002), Capelli et al., (2007), Sengupta et al., (2006),
Zalloua et al., (2008), Cadenas et al., (2008), Di Gaetano, (2009), Thanseem et al.,
(2006), and Msaidie et al., (2011). Depending on the comparative data, certain studies
had typed profiles using fewer STR marker loci, data was subject to truncation on the
number of useable loci from 19-markers to 12-marker haplotypes. A comprehensive
breakdown of comparative data exhibiting number of samples, population groups,
publication and/or in-house project and number of STR loci compared is included as
Appendix E. See Appendix E table S2.
Regarding matches to databases and published literature, the primary database
queried was the Y Haplotype Reference Database, the YHRD, which currently has
data compiled from 49781 haplotypes defined by seven major populations (which are
further divided into 20 subgroups). These include Eurasian, African, Afro-Eurasian,
East Asian, Amerindian, Australian Aboriginal, Eskimo Aleut, as well as an admixed
46
�population which has equal contributions from different ancestral populations
(Willuweit and Roewer, 2007).
2.3.1.1 Y chromosome haplotype Networks
The association of haplotypes Y-haplogroups was examined within clans using
reduced-median-joining (RMJ) networks constructed using the program Network
version. 4.6.1.1 (Fluxus-engineering) (Bandelt et al., 1999). Reduced-median-joining
(RMJ) networks were done by calculating reduced-median (RM) and subsequently
median-joining (MJ) trees. The combined RM-MJ technique was used to reduce
network complexity as an RMJ network is often simpler than a pure MJ network,
because implausible parallelisms have been avoided, where additional star
contraction preprocessing has been used (Bandelt et al., 1999). For each haplogroup
modal, ancestral haplotypes were listed with variant haplotypes and submitted as
related sequences for processing using a reduction threshold (r = 2, by default)
(Bandelt et al., 1999). STR markers were weighted proportionally to the inverse of
STR allelic variance (Cruciani et al., 2004). Data was cleaned and readied as an input
file for the RMJ network calculations using Microsoft Excel as the tab-delimited texteditor. During analyses the epsilon parameter criteria (which increases reticulation
possibilities) was set to zero (Network 4.6.1 user guide; Bandelt et al., 1999).
2.3.1.2 Database Search queries
The Y-STR Haplotype Reference Database (YHRD) international forensic STR
reference database allows for the assessment of male population stratification among
world-wide populations as far as reflected by Y-STR haplotype frequency distributions
(Roewer et al., 2001). Y haplotypes were blasted to the YHRD database in search for
global haplotypic matches at the 17-loci level of resolution as well as at the “minimal
haplotype” eight-locus level of resolution. In addition, the Genographic Consortium Y
chromosome database and the HGDDRL Y-STR comparative dataset, as well as STR
profiles from unpublished data collected in the HGDDRL were blasted and queried for
haplotype matches against profiles from European, Asian, Eurasian, as well as subSaharan-African populations (which include South African samples of a number of
different ethnic backgrounds as well as samples from the Maldives, Zanzibar and
Madagascar).
47
�2.3.2 Mitochondrial DNA analyses
The mtDNA haplogroups of all 198 subjects including the ten females sampled were
generated by using the online software prediction tool, Haplogrep, which operates by
comparing HVRI and HVRII variant sites to the mtDNA phylogeny available through
the PhyloTree platform (Build 16) (van Oven and Kayser, 2009). In addition, mtDNA
SNaPshot™ minisequencing was used for typing 17 coding-region SNPs to confirm
haplogroup identity. The regions of HVRI and HVRII which were sequenced ranged
from positions 15997-407 of the mtDNA molecule.
HVR sequences were aligned in BioEdit v 7.9, using the Clustal W algorithm (Hall,
1999) and variant sites were compared with the revised Cambridge Reference
Sequence (rCRS) (Andrews et al., 1999). The software program S-compare (Ronnie
Nelson, University of Pretoria) was used to identify and extract variant sites from the
alignment files. The accepted nomenclature used for mtDNA haplogroups is based on
that proposed by Behar et al., (2008), and van Oven and Kayser (2009) with recent
modifications as found on the Phylotree database (http://www.phyotree.org/).
Out of the 198 individuals originally sampled, 21 sibling pairs were observed by directly
counting them in the clan genealogies (Appendix C, Figures S1-S6). Duplicates from
these sib pairs were excluded from mtDNA analysis so as to avoid a bias in the data,
while the 51 individuals not affiliated with clans (including the ten females which were
sampled) were retained. This resulted in a subset of 176 individuals’ sequences which
were used in the subsequent analyses.
MtDNA haplotypes using HVR I and HVR II variant site data were used to construct a
phylogenetic tree using the Neighbour-Joining (NJ) method in the phylogenetic
software MEGA v5 (Tamura et al., 2007). The bootstrap consensus tree is taken to
represent the evolutionary history of the haplotypes analyzed, with the percentage of
replicate trees in which the associated taxa clustered together is shown next to the
branches. Branches corresponding to partitions reproduced in less than 50%
bootstrap replicates were collapsed. The tree is drawn to scale, with branch lengths in
the same units as those of the evolutionary distances used to infer the phylogenetic
tree. The evolutionary distances were computed using the Poisson correction method
and are in the units of the number of substitutions per site. All positions containing
48
�gaps and missing data were eliminated. Phylogenetic analyses of Neandertal mtDNA
suggests that it diverged from the extant human mtDNA lineage on the order of
660,000 years ago, and that Neandertal mtDNA falls outside the variation of modern
human mtDNA (Green et al., 2008). Since the mtDNA genome is maternally inherited
without recombination, these results indicate that Neandertals made no lasting
contribution to the modern human mtDNA gene pool, thereby making it a suitable
sequence to include as an evolutionary out-group for phylogenetic analyses. The
Neanderthal mtDNA genome sequence made available through the NCBI, under
GenBank accession number: NC_011137.1 was included as the out-group in the
alignment (Green et al., 2008).
49
�CHAPTER 3
Results
3.1
Y chromosome DNA studies
The Y chromosome results are presented three-fold: Firstly results are presented at
the haplogroup/SNP level indicating possible geographic locations of origin. The
results then proceed to discuss the associations of further resolved results at the
haplotype level in networks within haplogroups. Lastly, haplogroup/haplotype data is
consolidated with anthropological data of clan-genealogies and findings are presented
as well.
3.1.1 Y chromosome haplogroups
From the sample of 188 males including non-clan affiliated samples, 55.79% of Y
chromosomes segregate with non-African ancestry (Figure 3.1). When examining the
abeLungu and amaMolo clans only, the frequency of non-African Y chromosome
lineages escalates to 69.86% (Figure 3.1).
Individuals found to have Eurasian and European ancestry, had Y chromosomes
associated with haplogroups R1b (R-M343), R1a1a (R-M198), Q (Q-M242), G (GM201), I (I-M170) and J (J-M172). Haplogroup R1b was the most common haplogroup,
found at a frequency of 41.10% (Figure 3.1). This is the dominant haplogroup in
Western Europe and is also found in Eastern Europe and Western Asia (Kivilsild et
al., 2002; Campbell, 2007; Karafet et al., 2008; Chiaroni et al., 2009; Myres et al.,
2011; Raghavan et al., 2014). The second most frequently observed haplogroup,
R1a1a (R-M198), was found in 14.38% of the sample, is the dominant Y chromosome
lineage found in modern Eurasia, and is a prevalent in India and Eastern Europe and
the Caucasus region (Jobling and Tyler-Smith, 2003; Sengupta et al., 2006; Klyosov
and Rozhanskii, 2012). Haplogroup Q (Q-M242) is another haplogroup prevalent in
the Eurasian subcontinent, which was observed in 5.48% of clan-affiliated samples.
Haplogroup G (G-M201) is typically located in the Caucasus, the Middle East and
Southern Asia was found in two abeLungu Buku individuals (Cruciani et al., 2002;
Cinniog˘lu et al., 2004; Karafet et al., 2008). Haplogroup I (I-M170), appears in 8.65%
50
�of samples and depicts Western European origins mostly from Britain. It is the
haplogroup which occurs in nearly 20% of the European male population, but has also
been found among populations of the Near East, the Caucasus, Central Siberia and
Northeast Africa (Hammer and Zegura, 2002; Karafet et al., 2008). Haplogroup J (JM172) was found in one individual; this haplogroup is found at high frequencies in the
Middle East, North Africa, Europe, Central Asia, Pakistan, and India (Underhill et al.,
2001; Semino et al., 2002; Behar et al., 2004; Sengupta et al., 2006).
Several haplogroups with origins found in the sub-Saharan-African region were
observed at relatively low frequencies in clans and at higher frequencies (some greater
than 20%) in non-clan affiliates (Figure 3.1; Table 3.1). These included haplogroups
A1b1b2a (A-M51), B2a1a1a1 (B-M152), E1b1a1 (E-M2), E1b1a1a1c1a (E-M191),
E2b1a (E-M85), and E1b1b1 (E-M35). The most frequently observed haplogroup in
these samples was haplogroup E-M85, which was observed in 20 of the non-clan
affiliated individuals. Only one non-clan affiliated individual featured non-African
haplogroup R1a1a (R-M198) and one featured haplogroup I (I-M170) (Table 3.1).
Table 3.1. Y chromosome haplogroup distribution for non-clan affiliated samples
Haplogroup
(n=42)
Frequency
B2a1a1a1 (B-M152)
2
4.7%
E1b1a1a1c1a (E-M191)
9
21.4%
E1b1a1 (E-M2)
8
19%
E1b1b1 (E-M35)
1
2.38%
E2b1a (E-M85)
20
47.6%
I (I-M170)
1
2.38%
R1a1a (R-M198)
1
2.38%
51
�Figure 3.1. Phylogeny and frequency distribution of Y chromosome haplogroups observed i) in the abeLungu clans-people, as well
as ii) in the whole sample set, including non-clan affiliated samples. Nomenclature based on ISOGG (2016)
52
�3.1.2 Y chromosome DNA haplotype variation
Altogether 78 unique haplotypes were derived from the sample of 188 male individuals
using the 19 Y-STR loci system (in the order DYS19, DYS385A, DYS385B, DYS388,
DYS389I, DYS389IIc, DYS390, DYS391, DYS392, DYS393, DYS426, DYS437,
DYS438, DYS439, DYS448, DYS456, DYS458, DYS635, GATA H4), which are
summarised in Table 3.2(a) (non-African ancestry) and Table 3.2(b) (African
ancestry). To maximise the use of space for Tables 3.2(a) and 3.2(b), an abbreviated
haplotype-name format was used. For example, unique haplotype_4a within
haplogroup R1b (R-M343), is named “R343_4a”. Throughout the remainder of the text
however, haplotypes are named with the alphanumeric haplogroup name, followed by
the unique haplotype number, for example, ‘R1b_3’.
Network analysis permitted the examination of the relationships of haplotypes within
haplogroups R1b (R-M343), R1a1a (R-M198), I (I-M170), B2a1a1a1 (B-M152),
E1b1a1 (E-M2), E1b1a1a1c1a (E-M191) and E2b1a (E-M85) that had at least three
different haplotypes within them (Figures 3.2 - 3.8). Those haplogroups which did not
meet this criteria, like haplogroups G (G-M201), J (J-M172), Q (Q-M242), E1b1b1 (EM35) and A1b1b2a (A-M51), were excluded from network analyses. Note, in the
networks, branch lengths are proportional to the number of mutational steps between
haplotypes and the locus at which mutations are observed are shown. The size of the
circle is proportional to the number of individuals that have a particular haplotype and
nodes (positions in the network not found in the sample but which connects haplotypes
in the network) are shown as solid dots.
In addition to the haplotype networks, haplotype distribution within clans was also
examined in conjunction with genealogical information. In these genealogies
constructed from oral histories by Ms Janet Kalis, the genealogical information linking
extant males to their clan forefather, as well as their female relatives, including
(multiple) wives where applicable, are shown. Extended haplotype names were
superimposed next to individuals tested (Appendix C, Figures S1-S6). In these
pedigrees, triangles represent males, while circles are females, adopting the
nomenclature used by genealogists (which differs from that used by geneticists where
males are represented as squares). Filled shapes indicate sampled subjects.
Individuals with strikes through are deceased, which have been included to provide
53
�clarity with kinship. Suffixes (lower case) letters are necessary to differentiate between
individual haplotypes under a modal haplotype.
There was no haplotype sharing observed among clan members with European and
Eurasian derived haplogroups, however several African haplotypes are found shared
between individuals among different clans, namely haplotypes E2b1a_2, E2b1a_4,
E2b1a_6, E2b1a_9, E2b1a_16, E1b1a1a1c1a_10, and B2a1a1a1_2 (Table 3.2(b)).
The presence of African haplotypes within clan patrilines can be attributed to genetic
input by males from other Xhosa clans of the neighbouring region.
Note: Figure 3.2(a) and (b) cover two pages each to ensure maximized resolution.
54
�Table 3.2(a).Y chromosome STR haplotypes for the 13 abeLungu clans segregating with European
and Asian haplogroups R1b (R-M343), R1a1a (R-M198), Q (Q-M242), J (J-M172), I (I-M170) and G
(G-M201)
55
�Table 3.2(a) continued .Frequencies of Y chromosome STR haplotypes for the 13 abeLungu clans
segregating with European and Asian haplogroups R1b (R-M343), R1a1a (R-M198), Q (Q-M242), J
(J-M172), I (I-M170) and G (G-M201)
56
�57
Table 3.2(b). Y chromosome STR haplotypes within the 13 abeLungu clans segregating with African haplogroups E-M85,
E-M191, B-M152 and A-M51
E-M35, E-M2,
�58
Table 3.2(b) continued. Frequemcies of Y chromosome STR haplotypes within the 13 abeLungu clans segregating with African
haplogroups E-M85,
E-M35, E-M2, E-M191, B-M152 and A-M51
�3.1.2.1 Y chromosome variation linked with Eurasian origins: haplotypic
variation within the amaMolo
Acknowledging that matches to haplotypes are only as good as the data within
datasets and not representative of all Y chromosomes haplotypes found globally,
these data do support a non-African origin of Y chromosome haplotypes in the
amaMolo. Two distinct Eurasian haplogroups, namely haplogroup R1a1a (R-M198)
and haplogroup Q (Q-M242), were observed within the amaMolo clan genealogy
which spans 11 generations [Table 3.2(a) and Appendix C, (Figure S1)]. Five
haplotypes are associated with haplogroup R1a1a (R-M198) (Table 3.2(a)) and their
relationship with the modal haplotype R1a1a_2 are shown in Figure 3.2 below.
Figure 3.2. Haplogroup R1a1a (R-M198) RMJ network
Through comparison to the amaMolo clan genealogy we found that the R1a1a
haplotype was successfully transmitted in 52 out of 74 transmissions, with the modal
haplotype R1a1a_2 transmitted to 16 currently living amaMolo clan members
59
�stemming from Bhayi. Similarly, the modal haplogroup Q (Q-M242) haplotype was
transmitted successfully in 18 out of 28 transmissions from Pita (Appendix C, Figure
S1). Using 19 STR marker haplotypes, the closest match to the modal haplotype
R1a1a_2 was found in an individual of Hungarian descent, which differed with single
mutations at three loci (Pamjav et al., 2011). When the YHRD minimal eight-STR
marker set was queried, identical matches were found in 19 individuals from mostly
Eastern European countries namely Croatia, Lithuania, Russia, Poland, Romania,
Slovakia and Ukraine as well as to individuals from Belgium, Germany, Norway and
the USA. In the amaMolo clan genealogy, haplotype R1a1a_5 is seen in an individual
described as the brother to an individual who segregated with the R1a1a_2 modal
haplotype (Appendix C, Figure S1). Although these both segregate under the R-M198
SNP marker the variation in the STRs between these two haplotypes is too different
for the individuals to be considered biologically related. Thus the presence of the
R1a1a_5 haplotype supports the theory of multiple contributions from several nonAfrican founders.
3.1.2.2 Haplotypic variation within the primary abeLungu clans
The Y chromosome data reaffirms the historic and genealogical information regarding
the multiple contributions of the male founders to the primary abeLungu clans as well
as clans within the broader abeLungu clan family. The primary abeLungu clans are
those which are believed to have first originated from non-African shipwreck survivors
and include abeLungu Jekwa, Buku and Hatu.
Within clan Jekwa, 13 haplotypes were derived; seven of which were within
haplogroup R1b (R-M343). Majority of the clan Jekwa members appear closely
associated to the modal haplotype R1b_5 in a star-shaped phylogeny, suggestive of
recent expansions (Figure 3.3, Table 3.2(a)). The modal haplotype, R1b_5 was
successfully transmitted in 81 out of 100 transmissions in the abeLungu Jekwa clan
genealogy, which spans 12 generations tracing back to the clan forefather, Jekwa
(Appendix C, Figure S2).
Two inconsistencies were observed in the transmission of Y chromosome lineages in
the Jekwa clan genealogy (demarcated with red squares in Appendix C, Figure S2).
In both instances, siblings segregated with African Y chromosome haplotypes
60
�(E2b1a_9 and E2b1a_5) who were supposedly born from fathers segregating as
European haplogroup R1b (R-M343). These are accounted for as non-patrilineal
transmissions.
AbeLungu R1b haplotypes appear as uniquely segregating samples when examined
against comparative haplotype data, as well as to the YHRD. Haplotype R1b_5 did
not exactly match any of 33 Eastern Europeans (Jarve et al., 2009), nor any of 112
Hungarians genotyped in a study by Pamjav et al., (2011). When compared to data
published from studies done by the HGDDRL using 17 Y-STR marker haplotypes,
haplotype R1b_5 only partially matched to a single coloured-male sample from
Uitenhage in the Eastern Cape, having differed by single-step mutations at seven loci.
When the YHRD minimal eight-STR marker set was queried, identical matches were
found in eight individuals who were found in Spain, Switzerland, Germany, the Czech
Republic, the United Kingdom and the United States.
Descendants of the Hatu clan were linked with haplotype R1b_18 which features in
10 abeLungu Hatu individuals, which was successfully transmitted in 33 out of 38
paternal transmissions in the Hatu clan genealogy which spans 12 generations
(Appendix C, Figure S4). R1b_18 and its associated haplotype, R1b_17, (which
deviates from the modal haplotype by a single-step mutation at Y-STR locus DYS389
II) make up the second most prominent cluster in the R1b network and are more
closely related to each other than to the R1b haplotypes observed in other clans
(Figure 3.3 and Appendix C, Figure S4).
Two abeLungu Hatu individuals segregated with African Y chromosome haplotypes
(one, a haplogroup E2b1a individual, and the other, a haplogroup E1b1a1 individual)
were seen allegedly born from a haplogroup European R1b father. These too are
regarded as non-patrilineal transmissions which may have been introduced from
males of African origin from neighbouring clans (Table 3.2(b) and Appendix C, Figure
S4).
61
�Figure 3.3. Haplogroup R1b (R-M343) RMJ network
62
�Two out of three abeLungu Buku clan members shared exactly the same Eurasian
haplogroup G (G-M201) haplotype (Table 3.2(a)), which was transmitted successfully
in six out of nine paternal transmissions in the Buku clan genealogy. It is unsure as to
exactly how many generations there are before the Buku lineages trace to the original
founding father, since genealogical information was incomplete for abeLungu Buku,
but it is estimated to be at least four generations (Appendix C, Figure S5). Closest
matches of abeLungu Buku haplogroup G (G-M201) haplotypes were to a BetsileoMalagasy individual, a coloured-male sample from Uitenhage as well as a partial
match to an Egyptian individual, differing at seven loci, found in HGDDRL in-house
data from various projects (see Appendix E, Table S3: comparative data sources).
3.1.2.3 Haplotypic variation within the secondary abeLungu clans
Non-African ancestry was also observed in clans other than the three initial founder
abeLungu clans and the amaMolo. According to the oral history, these secondary
clans originated from founders who arrived in Pondoland at later points in time than
the three original abeLungu founders Jekwa, Buku, Hatu and the founders of the
amaMolo.
Three Ogle clan members originated from two R1b haplotypes, R343_8 and R343_14,
which segregated as lineages distinct from each other and from the majority of R1b
(R-M343) haplotypes, which may imply that these were two independent founders
(Figure 3.3; Table 3.2(a); Appendix C, Figure S5).
The haplotypes R343_16 (and its related variant, R343_15, differing at one STR
position) form the lineage tracing back six generations to Kristjan Caine, the founder
of the Caine clan (Figure 3.3, Table 3.2(a) and Appendix C, Figure S3). The two Irish
clan members featured a distinct R1b haplotype, R343_9, tracing back to its founder,
Irish, who lived only two generations prior to current clan members, which supports
the theory of multiple founding events having occurred at later points in time (Figure
3.3, Table 3.2(a) and Appendix C, Figure S3).
Three Sukwini samples emerge in the cluster of haplotypes including R343_10,
R343_11 and R343_12 (Figure 3.3, Table 3.2(a) and Appendix C, Figure S6).
Genealogical information for these three individuals is unknown so we cannot assert
relationship of these.
63
�Upon examining the Horner clan genealogy two distinct Eurasian lineages were
observed (Appendix C, Figure S3). The R1b haplotype R343_2, stems from the son
of Alfred Horner’s first marriage, Johnson (Appendix C, Figure S3 and Figure 3.3). The
wives of his subsequent marriages bore the sons Ramsay, Charlie and Teddy, all of
which who segregate with haplogroup I (I-M170) Y chromosomes, with the modal
haplotype I170_5, and haplotypes I170_4 and I170_6 deviating by single mutations
(Figure 3.4 and Appendix C, Figure S3). This may signify two lineages within the clan,
introduced by separate founders. A second haplogroup I-M170 lineage, I170_3,
distinct from those found in abeLungu Horner was found within the abeLungu France
clan, tracing back five generations to the France clan founder, Tshali (Appendix C,
Figure S5 and Figure 3.4).
Figure 3.4. Haplogroup I (I-M170) RMJ network
64
�When examined against comparative data the two haplogroup I (I-M170) modal
haplotypes were found to have several matches. Haplotype I_3 found in four France
clan members, was found to partially match two individuals from Archangelskaja and
Vologodskaja respectively, found published in Roewer et al., (2008). Haplotype I_5,
which was present in the one of the four Horner individuals was found to partially
match individuals from Noworgodskaja and Vologodskaja respectively as well.
Haplotype I_3 of clan Horner partially matched a coloured individual from Uitenhage
in the Eastern cape, and haplotype I_5 (also of clan Horner) partially matched a Xhosa
individual from the Eastern Cape, as well as to a Hungarian individual whose
haplotype data was found published in Pamjav et al., (2011).
To attempt to trace the clan name origins of the founders of the Irish, Horner and
France clans, several publications and databases were referred to. These included
the Type-III Irish Surname-Haplotype Reference Database, as well as the
genealogical studies by McEvoy and Bradley (2006), McEvoy et al. (2008), Klyosov
(2009) and King and Jobling (2009), who examined Y-chromosomal haplotype data of
Irish and British surnames. The two abeLungu-Irish clan members possessed
haplogroup R1b (R-M343) haplotypes which almost completely matched the ancestral
Irish R1b haplotype identified in Klyosov (2009) and McEvoy et al., (2008). The
haplotypes differed to the published sequence by only single mutations at Y-STR loci
DYS390 and DYS439, thereby allowing us to infer that these individuals have Irish
ancestral origins.
The Type-III Irish surname-haplotype reference database lists haplotypes for the
whole haplogroup-I tree and includes all sub-clades, most of which are genealogically
mapped to lineages of Irish surnames. The Jim Cullen sub-haplogroup I predictor,
available through the site, was used to query the five haplogroup I (I-M170) haplotypes
which had been resolved. Results showed that haplotypes I_1, I_2 and I_3 (found in
clan France) fall into the I-M253 sub-clade, while haplotypes I_4 and I_5 (both found
within clan Horner) segregate under the I-S24 sub-clade with 100% confidence. None
of these haplotypes segregated under the Dalcassian R-L226 cluster of haplogroup I
(I-M170) from Clare, Limerick and Tipperary - which is the predominant lineage of
Ireland - however they did match haplogroup I (I-M170) haplotypes found at high
frequencies in Ireland and Western Europe. Therefore, considering their Y
65
�chromosome haplogroups of western European origins (haplogroups R1b (R-M343)
and G (G-M201)), it is likely that the forebears of clans Hatu, Jekwa and Buku were
from the British Isles. It is not possible to say definitively whether these forefathers
were the three English men discovered with Bessie (Crampton, 2004), as there is no
genealogical evidence or biological link to her maternal lineage, with which to verify a
common geographical ancestry.
The sole haplogroup J (J-M172) haplotype observed in the sample set was of the
single abeLungu Thaka clan member. The sample was found to partially match a
Vologodskaja and Smolenskaja haplogroup J haplotype, differing by single-step
mutations at eight Y-STR loci, published in Roewer et al., (2008). This haplotype also
partially matched a Maldivian individual and a Malagasy individual genotyped in
studies undergone by the HGDDRL. When examining truncated 12-loci haplotype
data, the J-M172 haplotype was found to match one of 70 Malaysian-Indian
haplotypes published in Pamjav et al., 2011.
Fuzwayo, Hastoni and Sukwini clan members featured predominantly African
haplotypes (Figures 3.5, 3.6, 3.7 and 3.8, and Appendix C, Figure S6).
The judicious evaluation of genealogical history against molecular data has allowed
for the determining of the ancestral haplotype present in each clan which could
convincingly be traced to the clan progenitors documented in clan genealogies (Table
3.3).
66
�Table 3.3: Haplotypes and presumed geographic origin of abeLungu clan male founders
Clan
Founder
Haplogroup
Ancestral
Presumed
haplotype
geographic
origin
amaMolo
Bhayi
R1a1a
R1a1a_2
Eurasia
*Most likely
India
Jekwa
Pita
Q
Q_1
Eurasia
Jekwa
R1b
R1b_5
western Europe
*Most probably
British Isles
Hatu
Hatu
R1b
R1b_18
western Europe
*Most probably
British Isles
Buku
Buku
G
G_2
Eurasia
Ogle
Ogle
R1b
R1b_14
western Europe
*Most probably
British Isles
Caine
Kristjan
R1b
R1b_16
western Europe
*Most probably
British Isles
Irish
Irish
R1b
R1b_9
western Europe
*Most probably
Ireland
Horner (Alfred)
Johnson
R1b
R1b_2
western Europe
*Most probably
British Isles
Ramsay, Charlie
I
I_5
Europe
I
I_3
Europe
and Teddy
France
Tshali
67
�Thaka
Thaka
J2
J2_1
Eurasia
*Middle-East
Fuzwayo
Fuzwayo
B2a1
B2a1a1_3
Southern African
Hastoni
Hecton
E2b1
E2b1a_6
Southern African
E2b1
E2b1a_9 &
Southern African
(Hastoni)
Sukwini
Chwama
E2b1a_11
68
�3.1.2.4 Y chromosome variation linked with African origins
African haplotypes were found distributed predominantly among non-clan affiliated
samples, but are observed sparsely throughout the clan-affiliated sample as well.
African haplotypes were the only haplotypes to be found shared across clans, and
non-clan affiliates alike. The complexity of the African haplogroup networks is
attributed to the fact that haplotypes within African haplogroups are separated by many
mutational steps, indicating multiple contributions. The RMJ networks of all nonAfrican or Eurasian haplogroups do not feature reticulations and are all treelike forms
based on star-contraction phylogenies of satellite variants emerging from an ancestral,
founder, modal haplotype (Richards et al., 1998; Bandelt et al., 1999). However, the
RMJ networks for the African haplogroups E1b1a1a1c1a (E-M191), E2b1a (E-M85)
and
E1b1a1
(E-M2)
do
feature
reticulations
which
signify
ambiguous
connections/relations between haplotypes (Bandelt et al., 1999) (Figures 3.5, 3.6 and
3.7). This introduces doubt in the order of introduction of mutations, topology of the
network and consequently the chronology of the introduction of haplotypes, and is
indicative of more ancient, deeply-rooted haplotypes featuring greater diversity
(Richards et al., 1998).
The remaining haplotypes found within the abeLungu Jekwa clan are of African
descent, which included five E2b1a (E-M85) haplotypes. One haplogroup B2a1a1a1
(B-M152) and one haplogroup E1b1a1 (E-M2) haplotype was also observed in the
abeLungu Jekwa pedigree (Table 3.2(b) and Figures 3.7 and 3.8). These were most
likely due to non-patrilineal transmissions resulting in gene-flow and admixture from
the indigenous Xhosa gene-pool.
Three amaMolo clan members, one Fuzwayo clan member as well as two Sukwini
members segregate with haplogroup E1b1a1a1c1a (E-M191) haplotypes, while a
larger proportion of haplogroup E-M191 chromosomes are present in non-clan
affiliated samples, appearing as satellite haplotypes in the complex and diverse
haplogroup
E1b1a1a1c1a
(E-M191)
RMJ
network
(Figure
3.5).
Haplotype
E1b1a1a1c1a_10 was found to have matched the haplotype of a Khoisan individual
from Upington in the Northern Cape (haplogroup/haplotype data from research done
in the HGDDRL).
69
�Figure 3.5. Haplogroup E1b1a1a1c1a (E-M191) RMJ network
70
�Haplogroup E2b1a (E-M85) chromosomes appeared with more diversity. The largest
proportion of which were present in non-clan affiliated samples (39.0%), with seven
individuals identically sharing haplotype E2b1a_9 (Table 3.2(b) and Figure 3.6).
Haplotype E2b1a_9 is a modal haplotype within haplogroup E2b1a (E-M85), was seen
having given rise to 12 variant haplotypes, and pre-dates the arrival of non-African Y
chromosomes (Figure 3.6). This haplotype was also exactly shared by one individual
in the clan Buku, one in the amaMolo clan, one in abeLungu Jekwa and one in Sukwini
(Figure 3.6). Haplotype E2b1a_6 is also found shared within the amaMolo clan and all
of the members of the Hastoni clan (Figure 3.6). Haplotype E2b1a_9 also matched a
coloured individual from Middleburg in the Eastern Cape, genotyped in a previous
study by the HGDDRL unit. A contingent of haplogroup E2b1a (E-M85) haplotypes
were also present in all five members of the Hastoni sample, and were also found in
four Sukwini samples.
Figure 3.6. Haplogroup E2b1a (E-M85) RMJ network, featuring two reticulations marked A and B
71
�Haplogroup E1b1a1 (E-M2) haplotypes featured predominantly in non-clan affiliates,
but were observed sporadically in several clans as well (Figure 3.7). Haplotype
E1b1a1_8, found in three Sukwini samples, was found to have matches to an
individual from Northern Chad (unpublished data), as well as to two Malagasy
individuals.
Figure 3.7. Haplogroup E1b1a1 (E-M2) RMJ network
72
�Four of six clan members of the Fuzwayo clan possessed haplogroup B2a1a1a1 (BM152) chromosomes (Appendix C, Figure S6 and Figure 3.8). Haplotype B2a1a1a1_3
matched a Khoisan sample, sampled in Riversdale in the Eastern Cape. Lastly, the
haplogroup A1b1b2a (A-M51) haplotype, A1b1b2a_1, shared by two Sukwini subjects
matched to a Northern Cape Khomani individual as well as a coloured male from
Uitenhage in the Eastern Cape.
Figure 3.8. Haplogroup B2a1a1a1 (B-M152) RMJ network
73
�3.2 Mitochondrial DNA findings
3.2.1 MtDNA haplogroups
All maternal lineages of clan members and non-clan affiliated individuals are
exclusively of African origin, with the majority appearing within haplogroups L0d
(32.34%) and L3e (23.75%) (Table 3.4). The frequencies of the major macrohaplogroups resolved are L0 (44.44%), L1 (2.02%), L2 (19.7%), L3 (33.35%) and L4
(0.5%). The frequencies observed for mtDNA sub-haplogroups are presented in Table
3.4. The distribution of haplogroups by clan are also described in the charts of Figure
3.9 below.
The frequency of the L0 clades are up to 40% in different south-eastern Bantuspeaking tribes (Schlebusch et al., 2009; Schlebusch et al., 2011). Haplogroup L0d is
thought to be the oldest of the L0 clades and its distribution in southern Africa strongly
points to an origin among Khoe-San ancestors, which occurred prior to the arrival of
Bantu-speaking populations in southern Africa, and is found in the !Xun and Khwe
peoples at frequencies of 51% and 16% respectively (Salas et al., 2002; Schlebusch
et al., 2009). Haplogroup L3e comprises approximately one-third of all L3 types in subSaharan Africa and is the most widespread, frequent and ancient of the African L3
clades, which arose in Central Africa near Sudan around 35,000 years ago (Bandelt
et al., 2001; Soares et al., 2011).
74
�Figure 3.9. Distribution of mtDNA haplogroups by clan
75
�Figure 3.9 continued. Distribution of mtDNA haplogroups by clan
76
�Table 3.4. MtDNA haplogroup frequencies
77
�3.2.2 MtDNA haplotype diversity
The evolutionary relationships of the African mtDNA haplotypes are depicted in the
neighbour-joining (NJ) tree, drawn using the mtDNA HVR I and HVR II sequences
(Figure 3.10). MtDNA haplotype sharing between clans is observed to a much larger
degree than with Y chromosome haplotypes, where none of the non-African Ychromosome haplotypes were seen shared between clans and only several African Ychromosome haplotypes were found shared among clans.
From the 198 individuals studied, there are 117 unique mtDNA haplotypes observed,
23 of which were found to be shared between multiple individuals - both within- and
among- clans (Appendix D, Supplementary Table S2). Sixteen of these haplotypes
were found to be shared between individuals from different clans and in 14 instances
haplotypes were shared with non-clan affiliated samples as well. The two most
frequent haplotypes are those which appear in a haplogroup L3e2b clade with HVR
mutations 16172C, 16183C, 16189C, 16223T, 16320T, 16519C, 73G, 150T, 152C,
263G (appearing at a frequency of 0.068); and a clade within haplogroup L3e2b
featuring the variants 16129A, 16187T, 16189C, 16212G, 16223T, 16230G, 16243C,
16311C, 16390A, 16519C, 73G, 146C, 152C, 195C, 198T, 247A, occurring at a
frequency of 0.0625 (Appendix D, Supplementary Table S2). Out of the 21 sibling
pairs, two pairs did not share the same parental haplotypes - a clan France siblingpair segregated with haplogroups L0d2a and L0d1a, while a amaMolo sibling-pair
segregated under haplogroups L0d1a and L3e2b suggestive of non-maternity,
alternative modes of kinship or adoption (Appendix C, Figures S1 and S5).
78
�Figure 3.10. Neighbour-Joining (NJ) phylogenetic tree of 176 mtDNA haplotypes
79
�Depicted in the mtDNA-haplotype NJ tree are distinct haplogroups seen clustering in
the correct evolutionary topology; all abeLungu mtDNA haplotypes cluster alongside
the Neanderthal mtDNA out-group (Figure 3.10). Haplogroup L0 sequences are seen
branching off into their sub-clades, while L2 sequences are coupled near L3
sequences which cluster alongside the revised Cambridge Reference Sequence
(rCRS). The rCRS is defined by its variant sites as a haplogroup H sequence, which
clusters alongside haplogroup L3e sequences - its closest related sequence. This is
also consistent with the correct evolutionary history of mtDNA ancestry markers as
haplogroup L3 is the clade which migrated north during the Out of Africa expansion,
and became every other haplogroup (Behar et al., 2008). Clades where multiple
individuals share exactly the same haplotypes have been collapsed, with the
frequency of individuals sharing the specific haplotype indicated in brackets (Figure
3.10).
80
�CHAPTER 4
Discussion
4.1 Y chromosomes and genetic heritage
Y chromosome markers were used to trace the paternal ancestry of the abeLungu
from the Wild Coast region of the Eastern Cape. This study was conceived following
on discussions with Ms Janet Kalis, an anthropologist who has been conducting
genealogical and historical research among the abeLungu, to test the claims based
on their oral history about their “White” ancestry. Our laboratory subsequently
engaged in collaborative research with Ms Kalis to use genetic tools to test and/or
refine the oral and historical narrative. In this study Y chromosomes in a subset of
males representing various clans among the abeLungu were tested to derive their Y
chromosome profiles, which were then used to trace the most likely geographic region
of origins of their Y chromosomes. Given that the abeLungu are a patriarchal society,
Y chromosomes that are transmitted from fathers to sons, ought to segregate within
clans. Therefore, in the first part of the study, Y chromosome data was used to test
the oral history of the abeLungu, and also used to judiciously examine the transmission
of Y chromosomes within the clans to assess genealogical relationships. Apart from
determining the geographic regions of origins for the abeLungu, through the further
analysis of microsatellite haplotypes of both within- and between- clans, as well as
between clan members and Xhosa non-clan-affiliates, we were able to measure a
degree of population sub-structure which displays typical diversity patterns of founder
populations.
4.1.1 Y chromosomes and the founding fathers of the abeLungu
Throughout, the transmission of haplotypes generally remains consistent with the
transmission clan name in the genealogies. However, the oral history which has been
transferred across generations, depending solely on the memory of the present day
individuals representing it, has exhibited ambiguity and distortion over time in the
names, chronology and relations of clan members to their ancestors. This study, which
made use of Y chromosome DNA and mtDNA data in conjunction with clan affiliated
81
�genealogical data, was used to refine several anthropological questions pertaining to
the history of the abeLungu.
Following SNP analysis of 146 abeLungu clan members, we were able to resolve their
Y chromosomes using their global distribution patterns into African (30.12%) and nonAfrican (69.86%) derived Y chromosomes. The commonest haplogroup was R1b (RM343) which was found at a frequency of 41.10% (Figure 3.1). The amaMolo are
associated with two haplogroups; the first an Eastern European haplogroup, R1a1a
(R-M198), and the second with haplogroup Q (Q-M242) of West Asian origin. While
the abeLungu (Jekwa, Hatu, Buku) and the amaMolo are considered to be the earlier
mixed-race clans of the mPondoland, there are other mixed-race clans whose origins
stem from more recent non-African contributions into the mPondo gene pool (Soga,
1930; Crampton, 2004). They are represented by four France clan members as well
as six Horner individuals in our study who were found to have haplogroup I (I-M170)
chromosomes, and two-thirds of Buku clan individuals segregated with haplogroup G
(G-M201) chromosomes, which provides further evidence for non-African origins. A
single Thaka clan member presented a haplogroup J-M172 profile which matches to
two Eastern European individuals of Semitic origin in the YHRD, but does not contain
the extended-CMH nor the CMH (the Cohen Modal Haplotype defined by 12 specific
YSTRs originating from the Kohanim, who were the Jewish high priests) as described
in Soodyall, (2013).
Two lines of evidence demonstrate a remarkable relationship between Ychromosomal haplotypes and patrilineally-inherited cultural markers (clan names) the low within-clan diversity and high non-African haplotype-sharing within abeLungu
clans (Tables 3.2(a) and 3.2(b), as well as Figures 3.2 – 3.8), as well as a high degree
of haplotypic variance observed between clans, and in particular between Xhosa nonclan affiliates and clan members (Tables 3.2(a) and 3.2(b), as well as Figures 3.2 –
3.8). It also demonstrates the powerful male-specific founder effects of the European
and Eurasian castaways.
Regarding the rarity of haplotype matches to databases and published literature, the
primary database queried was the Y Haplotype Reference Database, the YHRD,
When abeLungu Y-haplotypes were queried against all populations of the YHRD using
the maximum number of STRs, it proved difficult to find matches and abeLungu modal
82
�haplotypes were found to cluster independently from nearest-match haplotypes, thus
indicating their rarity and uniqueness.
Upon examining the abeLungu clan genealogies in conjunction with haplotype data
several irregular aspects were discovered, while others were clarified. Clans which
featured Y chromosome haplogroups that could conclusively be traced back to nonAfrican founder individuals include the amaMolo, as well as the older abeLungu clans
Jekwa, Hatu and Buku. Non-African ancestry also featured in the more recently
established abeLungu clans Ogle, Caine, Irish, Horner, France and Thaka, however
the forebears of these clans were introduced from Europe and Eurasia at a later time
than that of the three primary abeLungu and amaMolo clans viz. variable time-depths
of clan genealogies [Tables 3.2(a) and 3.2(b); (Appendix D; Figures S1-S6)].
European haplogroup R1b (R-M343) features in the primary abeLungu clans Jekwa
and Hatu, as well as in the more recently established clans Caine, Irish, France,
Horner, Ogle and Sukwini. Similarly, Eurasian haplogroups R1a1a (R-M198) and Q
(Q-M242) feature in the amaMolo clan. European (and probably British) haplogroup I
(I-M170) is found in France and Horner clan members while haplogroup G (G-M201)
Y chromosomes feature in present-day clan Buku members, which indicates a more
Middle-Eastern or South-West Asian ancestry. The fact that the vast majority of
abeLungu and amaMolo clan members present with European and Eurasian ancestry
ultimately validates the cherished, but damaged narrative of their origins passed down
for ten-some generations, which states that their forebears were originally from very
distant shores.
Conflicting versions of the oral history exist about the origins of the three men who had
arrived with Bessie at Lambasi Bay (Soga, 1930; Crampton, 2004). A certain degree
of clarity on the relations of castaways has been achieved, where previously there was
suspicion from contradictory oral-historical details. Older beliefs were that they were
black or Indian men, where in more recent recollections they are considered white
(Soga, 1930; Crampton, 2004). The primary abeLungu clan founders Jekwa, Hatu and
Buku, were thought to share a common, white ancestry, and they were believed to
have survived the same shipwreck (Soga, 1930; Crampton, 2004). Crampton, (2004;
p12), noted that “Theories of the clan’s origins are linked to the story of the arrival of
83
�a young girl named Bessie on the Wild Coast along with three white men…the
abeLungu proclaim that they are descendants of white European castaways...”.
Soga (1930) described abeLungu clan forefathers Buku and Jekwa, as both being
descendants of Mbomboshe, from which we would expect their Y chromosome
profiles to be the same. On the contrary, our data reveals that Jekwa clan individuals
segregated with R1b (R-M343) Western-European ancestry, while the haplogroup G
(G-M201) chromosomes of Eurasian origin genotyped in 66% of abeLungu Buku clan
members, illustrates differing geographical origins and so, Buku was not a bloodrelative to Jekwa through Mbomboshe as perceived in the oral history.
Soga (1930) had also described Hatu and Jekwa as clans having two independent
origins from shipwreck survivors. Support for this claim is provided in the relationship
of Y-haplotypes in the network for haplogroup R1b (R-M343), in which a clear
separation with at least 10 mutational step differences occurring between haplotypes
of individuals from the Jekwa and Hatu clans was observed (Figure 13, Table 11a and
Appendix C, Figure S2 & S4).
Further support to Soga’s theory of the original founders being white castaways can
be associated with the abeLungu clan-founder names. Kirby (1953) and Soga (1930)
had noted that corruption of language through translation seems evident in the
interaction between isiXhosa speaking individuals and Dutch speaking as well as
English speaking individuals, primarily brought about through the phonetic linguistic
differences of these languages. What this means is that it is possible that mPondo
clans-people could have distorted the pronunciation of names of castaways and terms
from other languages like Dutch and English, since isiXhosa has borrowed words from
Khoisan click-sounding languages (Soga, 1930; Knight et al., 2003; Schlebusch et al.,
2009; Schlebusch et al., 2011). If abeLungu ancestor names were derived from
corrupted Anglicised roots, then the inherited names of the three English men may
have been “Xhosa-ised” versions of their English names. Crampton (2004) suggests
that Badi may have originally been Willem Billyert (or Bill Elliot), Hatu may have been
Hendrik Clarke (or Henry Clark) and Jekwa most probably was Thomas Miller - the
three men who had first assimilated with mPondo clans, and the same men who were
believed to have arrived on the Wild Coast with Bessie.
84
�The fact that the descendants of Hatu and Jekwa share differing haplogroup R1b (RM343) haplotypes, illustrates that these two patrilines stem from independent founder
individuals originally from Western Europe, ultimately validating a portion of Soga’s
research. We thus infer that Jekwa, Hatu and Buku are in fact three independent
founders who do not share a common ancestry, but who most probably arrived on the
Wild Coast having sailed from the British Isles and the Middle-East, quite possibly
aboard the same ship.
4.1.2 The amaMolo and their affiliation with the abeLungu
While socially and culturally the amaMolo are synonymous with the abeLungu, and
while the forebears of these clan families both retain non-African ancestry, they
originate from different geographical populations. The abeLungu clan-families
segregate with a Western-European background, chiefly under haplogroup R1b (RM343), while the amaMolo clearly segregate with a more Eurasian ancestral
background, bearing haplogroups R1a1a (R-M198) and Q (Q-M242). Only several
indigenous, deeply-rooted African haplotypes are seen shared between individuals of
the abeLungu and amaMolo clan families - most of which had been introduced via
gene-flow through extra-marital relations of abeLungu women with local Xhosa men
of the surrounding region; however there has been no evidence of shared European
or Eurasian haplotypes between the clan families. And so, we may conclude that the
amaMolo have emerged from independent lineages of founders different to those of
the abeLungu clan.
Soga’s genealogical studies (1930) state that the ancestors of the amaMolo are
believed to have originally come from either India or Malaysia. More recent accounts
however, state that the original amaMolo forebears were white Europeans (Crampton,
2004). The assumption of the amaMolo’s Indian origins however, is supported through
the presence of R1a1a (R-M198) haplotypes in the Bhayi lineage of the amaMolo although the exact geographical origin cannot be determined conclusively, as the
distribution of haplogroup R1a1a is relatively broad in Western Asia and Eastern
Europe (Klyosov, 2009). Previous studies by Sengupta et al., (2006) and Underhill,
(2010) on the Indo-European language family also show that haplogroup R1a1a (RM198) features in a large proportion of Indian males, which adds support to the notion
of Indian ancestry and Soga’s version of the amaMolo historical narrative. This may
85
�also validate the beliefs held by Soga and Kirby that ‘Molo’ may be derived from the
word ‘Moor’, pertaining to Indian Lascar slaves (Soga, 1930; Kirby, 1953).
The haplogroup Q (Q-M242) modal haplotype observed in eight amaMolo clan
members delineates a second ancestral lineage of Asian descent, originating from
another progenitor, Pita (Appendix C, Figure S1). There is a 100% effective father-son
transmission rate for descendants of the haplogroup Q modal haplotype. The Asian
haplogroup Q (Q-M242) is believed to have arisen in South Central Siberia, around
the Altai Mountains area, between 17,000 and 31,000 years ago (Zegura, 2004).
Since there are two lineages which segregate with different backgrounds within the
amaMolo clan, this clarifies that Bhayi and Pita were not biological siblings, but rather
two distinctive founders, from Eastern-Europe/Eurasia and Asia respectively
(Appendix C, Figure S1). These results also lend further support to Soga’s claims that
the amaMolo have black or Indian, rather than white ancestors.
4.1.3 Multiple founding events
The detection of Y-SNP markers like M170 and M343 in more recently established
abeLungu clans, with a high degree of inter-clan haplotypic variance, proposes that
clans originated from multiple founders of independent founding events and
shipwrecks. The frequency of mutations in haplotypes reflects the time-scale from the
point of divergence of castaways from their population of origin to their establishment
in the Eastern Cape. Anthropological evidence agrees with molecular data in
supporting the theory that secondary waves of non-African shipwreck survivors also
reached the Wild Coast, assimilated with the mPondo community and became
founders of other abeLungu clans at later points in time (Appendix C, Figure S3, S5
and S6). This is because the genealogies of more recently established clans are
proportionally shorter - having a decreased time-depth with fewer generations dating
back to respective clan founders than the genealogies of the three primary abeLungu
and amaMolo clans (Soga, 1930; Kirby 1953; Crampton, 2004). The more recently
established clans Caine, Irish, Ogle, Horner, France, Hastoni, Fuzwayo, Sukwini, and
Thaka feature genealogies which average three to five generations to the point where
their clan founders had arrived in mPondoland, while the older abeLungu clan
86
�genealogies (Hatu, Jekwa, Buku and amaMolo) trace back on average ten
generations to their respective founders.
4.1.4 Clan-affiliated Africans
The presence of ~30% of sub-Saharan African haplogroups A-M51, B-M52, E-M2, EM85, E-M191, and E-M35 in abeLungu clans may have been as a result of differential
gene flow and/or admixture from Y chromosomes of neighbouring, non-abeLungu
Xhosa clans - which acts to diminish non-African ancestry diversity, as well as the
degree of clan-name/haplotype coancestry. Input into the mPondo gene-pool by nonAfrican founders is restricted to abeLungu clan affiliates. This is shown by the general
absence of non-African haplogroups, and a high frequency of African haplotypes in
the non-clan affiliated individuals (n=42), which were sampled from the surrounding
regions of abeLungu clan lalis (homesteads). Only few African haplotypes were seen
shared amongst Xhosa non-clan-affiliated individuals (Table 3.2(b)). These clanaffiliated individuals which possess African haplotypes, hence “African Africans”.
These are also examples of possible non-patrilineal transmissions.
Given that kinship relations and genealogical information were not sourced for nonclan affiliated samples, it is possible that cousins or other male relatives were included,
resulting in higher type-sharing of African haplotypes which are common to the region
and its cohabiting populations. Fuzwayo, Hastoni and Sukwini are three abeLungu
clans which exhibit almost entirely African ancestry. Only three Sukwini individuals
carried Western-European haplogroups (Table 3.2(a); Appendix C, Figure S6). This
brings into question the true ancestral identity of these clans, and whether they actually
had non-African ancestry in their patriline to begin with, which may have been diluted
out through various processes such as non-patrilineal transmissions - or whether the
notion of their foreign ancestry was an artefact of their cultural associations and
geographical proximity with other abeLungu clans.
Alternatively, this could be an example of other Y chromosome patterns of
transmission representing the social practices and customs of the mPondo. It is not to
be taken for granted that we have an exact measurement of father/son pairs, because
culturally, what may be interpreted as a father/son relation, may not be the case
87
�biologically. Regarding terms of kinship in the amaXhosa, the term brother (“bhuti” in
isiXhosa) has a broader use and a greater social impact in Xhosa culture than in
Western society, which generally uses the term to describe a biologically related male
sibling. In Xhosa culture, a brother is the son of a man related to an individual’s father
through paternal kinship, which includes an individual’s brother, uncle, cousin, or a
man with a shared father's clan name. Bhuti is also a term used for showing respect
for hierarchy by age and to address an older male individual. Bhuti also refers to a
young man who has returned from initiation school, and may also be used when
referring to another man who had undergone initiation prior to him (Young and
Jackson, 2011). This may create conflicting inheritance patterns for inferring and
understanding relations when Y data are checked against genealogical data. These
types of scenarios, in which social relatedness and biological relatedness do not
correlate, need to be addressed delicately. In the event of such a situation, the Chief
of the clan was informed prior to the individual, as they are in each instance aware of
all relations and have knowledge of any “illegitimacies”.
4.1.5 Factors which shape clan diversity
Factors affecting clan diversity, which are inherent to small groups of individuals, may
lead certain haplotype lineages to extinction and thus reduce the Y chromosome
genetic diversity, while others may act to increase the Y chromosome diversity withinand between- clans (Chaix, 2007).
One limiting factor was the sampling geography - where sampling of families in remote
locations was more often than not the circumstance, and there was great difficulty in
assembling subjects at one ___location for sampling. Translation was necessary to
convey the premise of the study, but the process was time-consuming, which limited
the number of families which could be sampled in a day.
Other factors which shape diversity include non-patrilineal transmissions (NPTs) and
multiple founders for names (where individuals with the same clan-name have
different haplotypes). Progeny having a certain ancestral background, with their
fathers exhibiting a different one, are most likely a result of illegitimacy, non-paternity,
maternal surname inheritance, name changes or adoption. Together we refer to these
as non-patrilineal transmissions (NPTs), which will act to introduce exogenous
88
�haplotypes into a surname-lineage or clan (King and Jobling, 2009). The incidence of
non-paternity was found to have been low; only six out of the 146 clan-affiliated
individuals sampled were NPTs (4.1%). Two instances where NPTs were observed
were in the Jekwa and Hatu clan genealogies (Appendix C, Figures S2 and S4). In the
Jekwa clan, two individuals carrying European R1b_5 haplotypes were found bearing
progeny with African haplotypes, namely E2b1a_9 and E2b1a_5. Similarly, in clan
Hatu, an E2b1a_4 individual and an E1b1a1a_14 individual, were recorded as
progeny of individuals carrying the modal haplotype R1b_18, which is also European
in origin (Appendix C, Figure S4). These individuals are not related biologically to their
“fathers”, and were most likely the result of NPTs such as infidelity or adoption. There
are six clear-cut examples of NPTs observed in clan genealogies (Appendix C; Figures
S1-S6), however there is possible indication for a higher frequency of non-patrilineal
events due to the presence of African haplogroups in clans, however father or sibinformation is not available to definitively state in case whether these events are what
they seem. The informed consent pages distributed prior to sampling did not state that
NPTs could be discovered or disclosed to the subjects, however the matter was
discussed with clan elders. In report-backs to clan members all NPT cases and
possible NPTs were relayed back to clan elders first, who then took it upon themselves
to disseminate the information back to specific clan-members and families as they
were the ones who were informed of all kinship relations and cases of adoption and
non-paternity.
“Daughtering-out” is a process which also results in stochastic variation in the number
of sons fathered by different men, which over many generations can lead to the
extinction of Y chromosome lineages and the increase in frequency of others within
clans (King and Jobling, 2009). Absence of migration of men among clan descent
groups further exacerbates the strength of genetic drift. Thus, although some Y
chromosome haplotypes might go to extinction, others might reach rapidly high
frequencies within a clan and thus give rise to the so-called identity core-haplotypes
(Chaix, 2007). Similarly, genetic drift which occurs due to random changes in
haplotype frequencies over the generations acts to either reduce/increase diversity.
Mutation rates also affect haplotype diversity and can be used to infer whether a
random or a causative change in inheritance has occurred, which distinguishes truly
89
�coancestral haplotypes from stochastic variants (Jorde et al., 1998). Jorde et al.,
(1998), Gray et al., (2000) and Kayser et al., (2000) show that the average STR
mutation rate (of ± 2.5 x 10⁻³ per locus per generation) is much higher than that of
single nucleotide polymorphisms (which mutate at a rate of 10-7 to 10-8 per generation).
While SNPs mutate more slowly and provide an indication for deeper ancestry,
microsatellites have average mutation rates about five times higher and therefore one
may expect to see mutations on the timescale of this type of surname (clan-name)
study (Klyosov et al., 2009). Rates of loci also vary depending on their structural makeup (i.e. whether they are tri-, tetra- or penta- nucleotide repeats) (Butler et al., 2002).
An example of a comparatively slowly mutating marker is trinucleotide repeat-marker
DYS388 which is more impactful than other hypervariable markers (Klyosov 2009).
The STR markers selected in the STR YFiler™ and Multiplex II PCR panels reflect: i)
the consideration of the rates of change of STR markers within a broad enough
haplotype and ii) the estimated time-span from which the founders purportedly
established clans.
A striking difference in average STR mutation rates is observed, depending on
whether the evolutionary estimate is used, or whether the rates were calculated by
direct count in deep-rooted pedigrees (while assuming one generation consists of 25
years) (Jorde et al., 1998; Forster et al., 2000; Zhivotovsky et al., 2004). Therefore, a
direct-count of the father-son transmission rate of Y chromosome haplotypes in
genealogies reflects the time-depth of the constructed clan genealogies, and is a more
suitable indicator than an evolutionary mutation rate for this study. The occurrence of
mutations in within haplogroups that give rise to the diversity of haplotypes within
haplogroups probably reflects the time-scale from the point of introduction of a lineage
from castaways to the present-day population established in the Eastern Cape. If we
use the date which the oral and documented history places the primary abeLungu
clans’ founding to be in 1723 (Soga,1930), which was 287 years before present-day
clan members were sampled in 2010, the time span equates to ~11 generations ago,
with one generation consisting of approximately 25 years (Kayser et al., 2000). This is
consistent with primary abeLungu clan genealogies, which exhibit on average 11
generations between the clan progenitor and present-day clan members.
90
�An example that testifies to this is an amaMolo individual who carried haplotype
R1a1a_5 which was markedly different from other R1a1a (R-M198) haplotypes
(Figure 3.2), particularly with that of his alleged “brother” (according to the genealogy
and consent form information) who segregated with the R1a1a_2 modal haplotype
(Appendix C, Figure S1). The 16 mutational step differences between these two
haplotypes shows a divergence too great for these individuals to be biological siblings,
which implies illegitimacy or non-paternity and reduces the father/son transmission
efficacy of the modal haplotype in Bhayi’s lineage. Assuming the average STR
mutation rate estimated by Jorde et al., (1998), Gray et al., (2000) and Kayser et al.,
(2000) is ~2.5 x 10⁻³ per locus per generation, it is not possible to have observed
related haplotypes bearing 16 mutational differences within the given historical timeframe, which reaffirms that the R1a1a amaMolo brothers are in fact not related. An
alternative explanation for the presence of this haplotype may be from another
haplogroup R1a1a (R-M198) founder, possibly from an entirely different shipwrecking,
which was introduced into the clan at a later stage.
4.2 The maternal legacy of the abeLungu
While the main focus of the study was to assess the concordance between the oral
history (including genealogical records) of the abeLungu and patterns of Y
chromosome variation within and among clans, we also made use of mtDNA to
examine the maternal ancestries of the abeLungu. Given that that written records
claim, for example the story of Bessie (Crampton, 2004), that some women who
survived ship wrecks were also integrated into the local community, an assessment of
mtDNA haplogroups (using their known geographic patterns of distribution), would
help us trace the origins of woman who contributed to the mtDNA pool of the
abeLungu.
These results showed that all individuals had mtDNA haplogroups that were traced
exclusively to African origin, with the majority being found in haplogroups L0d and L3e
(Table 3.4). The presence of L0d lineages would suggest that the maternal history of
the abeLungu is associated with recent admixture from the Khoi and San groups
(Schlebusch et al., 2009). MtDNA variation patterns indicate high within-clan genetic
diversity, low levels of among-clan differentiation, suggesting virtually random female
91
�mediated gene flow among clans of deeply-rooted ancestral mtDNA haplotypes. Their
mtDNA is bound to be from different mothers married into the clan, hence the
increased diversity. Two factors have an effect on mtDNA diversity patterns: Polygyny,
which is traditionally practiced in abeLungu clans (with the number of wives often
depending on the wealth of the husband) may result in higher mtDNA diversity (Soga,
1930; Crampton, 2004; Jackson, 2005). The increased levels of mitochondrial
diversity observed in clans might also be a consequence of the complex rules of
exogamy in practice in abeLungu clans. Traditionally, a man must choose a bride so
that he will not share a common ancestor on the paternal lineage with her for a given
number of past generations (Crampton, 2004; Chaix, 2007). This number is usually
close to the genealogical depth of a lineage (five to ten generations depending on the
population), so that in practice the bride usually belongs to a different lineage (lineage
exogamy). These rules of exogamy imply that, at each generation, a significant
number of women migrate from one descent group to another, amounting to increased
diversity (Chaix, 2007). The molecular evidence is congruent with oral history in that
a non-African input is clearly detected in the patriline, and that only Southern-African
haplogroups are witnessed in the mtDNA lines of the abeLungu clans. This indicates
that, apart from a small non-maternity rate, abeLungu women maintained fidelity and
their African maternal ancestral legacy, which has stood through the tests of changing
male population demographies.
As a corollary to examining the Y chromosome lineages which reflect the transmission
of clan name, it would have been interesting to detect non-African ancestry in the
mtDNA of clans-people, which may or may not have been derived from Bessie and
her marriage into the amaTshomane clan; however, this has not been observed.
Bessie’s story tells of how she became part of the mPondo people, had to learn their
language and practice their customs, her marriage into the amaTshomane clan, the
death of her husband and her subsequent remarriage to his brother Sango. Her story
contains several mysterious elements like the unconfirmed identity of the “three
Englishmen” who supposedly accompanied her upon her arrival on the Wild Coast, as
well as putative links to other shipwrecks’ surviving castaways, with particular interest
placed upon one of the more famous ships, the Grosvenor wrecked in 1782 and its
legendary bounty, which to date remains a mystery (Soga, 1930; Crampton, 2004).
Soga recalls Bessie’s affiliation (the only link, which has no relevance unfortunately):
92
�“They were given isiXhosa names; the men were called Jekwa, Badi and Hatu, and
the girl, Gquma. Having all come from the same ship (interpreted locally as a house),
they were considered to be family, with Badi and Jekwa seen to be brothers and
Gquma, the daughter of Badi”.
Bessie married and bore children, including her daughter Bessy, but her offspring
would have belonged to the clan of their father - amaTshomane – and not abeLungu,
making her inclusion as a major founder not only unusual, but also fundamentally
contradictory to the principles of patrilineal descent. The little that is known about
Bessy’s family tree has survived the generations and has been passed down by oral
history. Soga (1930) accounts: “Gquma died at Mgazi about 1770. Her daughter Bessy
married Mjikwa, son of Wose, Chief of the amaNkumba clan, and Principal Son of the
Great House of Zwetsha - the premier clan of the amaBomvana. Xwebisa and
Gquma‘s family, claiming foreign heritage, still retains by virtue of descent through the
male line the original clan name of the amaTshomane, derived from Tshomane,
Xwebisa’s father” (Soga, 1930, p.380) (Figure 20). No trace of Bessie’s European
history was found in the mtDNA haplogroups of maternal lines. This too was expected,
considering no direct efforts to trace Bessie’s descendants could be made due to the
patriarchal mechanisms of inheritance of Xhosa clan name, and the lack of a social
marker to parallel mtDNA inheritance.
Further collaborative steps can be made, beginning with deeper and more widespread
anthropological research, so as to attempt to trace the mitochondrial lines stemming
from Bessie and other potential female survivors. This would be a difficult task,
considering there are no female cultural markers to parallel the patrilineal inheritance
of the abeLungu clan name. Tracing maternal ancestry has been successful in several
studies, however the proposed reconstruction of social relations, especially that of
matriclans, is based on very thin evidence for traditional - that is, pre-1900 times
(Pollock, 2009). Some of the seminal studies on populations that exhibit matrilineal
modes of inheritance include that of Godard (1867) on the Sudanese Nubians, the
study on Iroquai and Hopi Native Americans by Freire-Marrecco (1914), the Vanatinai
of Papua New Guinea by Lepowsky (1981), and the Rapanui in Polynesia by Hage &
Marck (2003). More recently, Starck, (2013) studied Minangkabau of West Sumatra
who form the largest matrilineal society in the world. The life in the core areas was
93
�defined by a matrilineal way of life. This means there are certain kinship groups which
follow the female descent of a mother. The woman’s brother is responsible for her
children rather than her husband. These studies have investigated these cultural
groups which exhibit matrilineal and matrilocal inheritance of clan name, so as to trace
their matrilineal origins. These studies are the biological and socio-cultural
counterparts to the ancestry studies of those like this study on the abeLungu, and they
need to be used as guides for future studies on the abeLungu for the discovery of
Bessie’s maternal legacy.
The only detail that historical data provide is that it is suspected that Bessie was a
crew member aboard one of the Dutch East India (VOC) vessels which became
wrecked sometime around 1737, which remains unconfirmed to date. To investigate
the maternal line deriving from her daughter Bessy who married Mjikwa would be the
one means at discovering European maternal ancestry. However, the family line leads
up to an individual Sizungazane, who died in 1921 (Figure 4.1). There are no records
as to whether this individual had any offspring who may have continued the maternal
ancestral legacy of Gquma (Bessie), her daughter Bessy and their European origins
(Soga, 1930). Even if there are historical examples of female European castaways,
their non-African maternal ancestry would most likely be diluted out within a few
generations, due to admixture from the mtDNA haplotypes of local Xhosa women
which clan males had married.
Examples of matrilocality exist within the amaXhosa, albeit sparsely. Kalis, in her
interviews recorded in 2009: “…For example, a friend whose patrilineal family resides
in the Tsomo village in which his amaThembu great-great-great-grandmother was
born. She married an Englishman by the name of Jonas (possibly a trader) in the midnineteenth century, and their descendants took their mother’s clan-name,
amamTolo". Kalis also has a colleague whose mother’s family hails from Holy Cross
and traces its descent from a shipwreck survivor. Through simply discussing her
further research plans with people in and around Mthatha, Kalis had also received
suggestions of additional clan names which require following up.
94
�Figure 4.1. The amaTshomane clan genealogy featuring the lineages and the progeny
born from Xwebisa (Sango) and Gquma (Bessy) (adapted from Soga, 1930, p.380)
4.3 In summary of the findings
These demographic and genetic processes may explain not only the existence of the
core identity haplotypes at the Y chromosome and mtDNA levels in clans, but also
their overall lower Y chromosome diversity compared to non-clan affiliates in
neighbouring, cohabiting regions, as well as the higher diversity of deeply-rooted
mtDNA haplotypes. The prevalence of non-African haplogroups in the vast majority of
abeLungu and amaMolo clan members with coancestral haplotypes ultimately
validates the hypothesis put forward in the documented and oral history (Soga, 1930;
Kirby, 1953; Crampton, 2004). Analysis of the results provides evidence for the
relevance of the dual inheritance model (culture and genetics) in understanding
patterns of human genetic variation, as inferred by gene-culture coevolution theory
(Jobling, Rasteiro & Wetton, 2015). Analyses indicate that the dynamics of patrilineal
descent groups imply different male and female socio-demographic histories, as well
as the fact that patrilocality, NPTs and polygyny are primarily responsible for these
sexually-asymmetric genetic patterns.
95
�4.4 Future Studies
Sampling of a wider variety of clan names and genealogical histories will contribute to
alleviating any current social or geographical bias, leading to interesting new insights
of cultural and demographic history (King and Jobling, 2009[b]).
Admixture analysis would be needed to further refine origins and relations within clans
of the Pondoland region as well. Autosomal Ancestry Informative Markers (AIMs) are
distributed abundantly throughout the genome, and have shown to retain
geographically restricted allele frequency distributions which serve as indications for
the likely parental populations of the samples being investigated (Phillips, 2007; Hinds,
2005). Autosomal SNPs with population specificity to those of likely parental
populations of the samples can be screened for using an array of autosomal ancestry
informative markers (AIMs), selected from published data, found in European, African,
Asian, Eurasian, Middle Eastern and Oceanic populations, so as to uncover any
possible genetic substructure and/or admixture, in order to complement findings from
Y chromosome and mtDNA data. In these tests, AIMs are examined and compared
with frequency data of these markers in the surveyed groups. The results of this
comparison are then statistically analysed to produce a break-down in the form of
percentages of different ancestries (Nash, 2006). These percentages are therefore
not a measure of the number of ancestors of different backgrounds within an
individual’s genealogy, but rather an estimate that depends on the initial selection of
subjects, the examination of particular markers, complex statistical calculations and
the system of ordering patterns of human diversity into the main continental groups
(Nash, 2006).
Fejerman (2005) suggests that if an admixture event had occurred many generations
ago, then African alleles would be expected to be widespread among individuals.
However, if it took place only two or three generations ago (as in the case of some of
the secondary abeLungu clans, with more recent ages of establishment), we would
expect to observe a small proportion of individuals in the sample with a relatively high
probability of having African ancestors. He attributes this to the fact that the ‘immigrant’
alleles do not have time to become established among individuals of the endemic
population, but rather tend to remain concentrated within families. Autosomal tests do
provide a degree of statistical certainty about the proportions of different groups in
96
�one’s ancestry; however, the results are more of an artefact of a series of
approximations that underestimate the complex ways in which ethnical and racial
identities are socially defined and experienced. Another misappropriation of admixture
analyses is that they can easily be interpreted as supporting to the idea that racial or
ethnic categories have a genetic basis (Fejerman, 2005; Nash, 2006).
Comparative diversity analysis between populations will tell us about differences in
their histories, and knowledge from multi-allelic marker mutation rate analyses will
allow for estimates of the age of the most recent common ancestor of the group of
chromosomes examined. These kinds of studies have implications beyond the field of
Y chromosome research, as they can reveal signals of population structure and history
which are important in choosing populations for mapping genes underlying complex
traits (Jobling and Tyler-Smith, 2000). Most new advances will emerge from the
exploitation of recent technological developments. Improvements to the methods of
analysis of ancient DNA should enable the testing of genealogical links between living
individuals and putative patrilineal ancestors and also among archaeological human
remains (Fejerman, 2005; Nash, 2006). High-resolution Y chromosome typing and
mitochondrial DNA sequencing, together with whole-genome SNP analyses, should
enable reliable reconstructions of genealogies; these will include the establishment of
links across the sexes, which cannot be achieved by the analysis of uni-parentally
inherited markers alone. In terms of relatedness, surname/clan-name—ascertained
cohorts of men who share Y-chromosomal coancestry lie between the traditional
pedigree and the population substructure, and application of whole-genome typing to
such groups could be useful in understanding the history of recombination, and for
genetic epidemiological purposes. With the decrease in cost of sequencing, private
individuals will fund their own genome projects, and it seems inevitable that SNPs
specific to surnames, clan names or their lineages will be identified, providing powerful
resources for genealogical research.
97
�4.5 The impact of human population diversity and genetic genealogy
studies
No single record of the past is more important than another, but each one records
different features of the past. The utility of DNA over time is similar to that, in
archeological terms, of bones which have been exhumed, as it also provides us with
a clearer image of our past. Heritable clan-names, like surnames, are unique cultural
markers of coancestry, that represent a rich resource for the analysis of human
diversity (Kayser et al., 2003; Jobling, 2015), archaeology (Paabo et al., 2004; Green
et al., 2010), history (Moore et al., 2006), genealogical descent (Foster et al., 1998;
King and Jobling, 2009 [a and b]) and disease (Pritchard et al., 2001). The effort to
understand human origins and history of migration is intrinsic to our basic human
nature and curiosity.
As we track the ancestors from geographical stopping points we uncover the history
of the migration routes of anatomically modern humans that left Africa between 35,000
and 89,000 years ago (Underhill, 2000). A minority of contemporary East Africans and
Khoisan represent the descendants of humankind’s most ancestral patrilineages.
Examining the utility of heritable DNA on a more recent time scale allows for the
detection of ___location and migration of clan-groups and surname lineages. Clan-names
are patrilineal, and so men sharing surnames might be expected to share related Y
chromosome haplotypes, because these are also passed down from father to son
(Jobling and Tyler-Smith, 2003). However, the strength and structure of the
relationship between the two could be influenced by a number of additional factors
(Jobling, 2001). Mutation will alter haplotypes through time, although, on the timescale
of clan-names, this will only affect rapidly mutating markers such as short tandem
repeats (STRs) (Jobling, 2015). Knowledge of mutation rates and processes allows
this to be taken into account. Similarly, differences in the number of founders at the
time of surname/clan-name establishment within a given population could affect the
number of descendant lineages within a clan-name (King and Jobling, 2009[b]).
There are several advantages to using molecular data when investigating population
structure, namely: molecular entities are strictly heritable and the description of
molecular characters (mutations) is unambiguous, unlike oral history which is subject
to large degrees of distortion and incoherence. Molecular data are abundant and
98
�amenable to quantitative treatment - we can statistically measure support for
hypotheses. Homology assessment is easier and more reliable with molecular data
than with morphological traits, which have been typically relied upon in the past. There
is some regularity to the evolution of molecular traits as well, which allows for accurate
measurements of demographic expansion timings. The population-specificity of binary
markers used in combination with microsatellites in Europe and elsewhere has proved
useful in analysing clan-names that are thought to reflect origins outside a particular
region, such as for those formerly British clan-names like Ogle, Caine (or McCaine),
Irish and Horner might suggest.
4.6 Genealogy testing and its limitations
In more recent times there has been an upsurge of commercial ancestry testing
companies, offering services aimed to situate individuals within global patterns of
human genetic diversity, locate genetic origins and sort out true biological relatedness
from practiced kinship (Shriver and Kittles, 2004; King and Jobling, 2009). Most of
these companies assert that DNA evidence can provide a link between possible
branches of a family tree when there is difficulty in establishing a connection by other
means (Shriver and Kittles, 2004; Nash, 2004).
Ancestry test results are depicted through the familiar graphics of the human family
tree and explained via recognised but newly geneticised notions of human
reproduction, ancestry and inheritance. Ancestry testing defines the most recent
association of popular and scientific models of ancestry and descent in geneticised
genealogy, and signifies the cultural work of authorising genetic answers to questions
of relatedness and identity.
However, as these tests are novel and still under-developed, much of the public is
often apprehensive to undergo testing due to the controversies associated with
personalised genetic histories - but for the most part, these controversies have more
to do with the complex history of race, discrimination and prejudice than the science
behind genetic ancestry itself. The outcomes are variable: for some individuals, the
results may be disconcerting and the experience at attempting to interpret the meaning
of the test results for personal or familial interpretations of origin and identity, is
99
�sometimes complicated and often unsatisfactory. For others still, they can be only
marginally interesting, or end up even having very little significance, while for certain
people the tests provide, as testing companies assure, a meaningful and significant
sense of ancestral origin (Nash, 2004; Shriver and Kittles, 2004). Regarding the clanaffiliated subjects who received their ancestry reports the outcome was welcomed and
one of gratitude from the abeLungu for contributing to validatating their unique
ancestry.
Traditional anthropological genealogy should in theory be able to provide a family tree
that includes all the sets of great-grandparents, great great-grandparents and so on,
whose genetic material has been mixed together and passed on to a present day
individual. Genetic genealogy however cannot inform the public about the complex
blend of genetic material people have inherited from all the preceding ancestors of
that individual. The narrowness of the tests and their dependence on the form of direct
transmission, from fathers to sons in the case of the Y chromosome, and from mothers
to children in the case of mtDNA, makes them useful in exploring patterns of descent.
However, this specificity also means that the tests only focus on a small portion of
DNA which is inherited directly (Nash, 2006).
Technically more advanced tests that employ genome-wide association to infer
genetic 'ancestry painting’, admixture analyses, or one’s percentage 'global similarity'
to other people in the world, oversimplify the genetic data (and as a result the
individual’s identity), reducing it to something as scientifically lacking, but historically
marked, as ‘European' (Bhattacharya, 2010). Also, considering the time-scale of
genetic ancestry tests and the results of a genetic genealogy test alone, without
comparison to other socio-cultural genealogical narratives, these tests do not provide
information on more recent ancestors who could have lived in many different places
(Nash, 2004).
It is noteworthy for clients of genetic ancestry tests to consider that while haplogroups
are presented as personal results which suggest their special link to the customer,
(through claims that their result is their ‘unique genetic signature’), these haplogroup
designations are in fact shared with millions of other people. The estimated genomic
variation of any one person differs from that of another by only 0.1% to 1%, which in
turn means that the vast majority of the genes that are said to make us who we are,
100
�are invariably shared with every other human. This means that the axiom that most
testing companies exploit, namely ‘Genes make you who you are as a unique
individual’ actually have very little discrimination capacity, other than in ascertaining
‘ethnic or geographical origins’, or in some instances, the compositional breakdown
thereof (Shriver and Kittles, 2004; Nash, 2006; Jobling, 2015).
Genetic genealogy tests provide individual results which may have implications for
other relatives who, as discussed above, in the case of Y-chromosome tests share
paternal descent, and in the case of mtDNA tests share maternal descent. The
information that the results suggest about ethnic or geographical origins that a person
receives is therefore pertinent to other family members who may not have chosen to
acquire this knowledge, and for whom it may complicate or disturb their particular
sense of cultural or ethnic identity. Examples exist, such as is frequently the case,
where Y-chromosome tests results can point to a white male ancestor for AfricanAmerican or British black men - as is the case with the abeLungu, who rather praise
their foreign ancestry than feign it. In other cases, when the oral history seems
irrefutable, the DNA evidence may sometimes be conflicting, and may provide
unwelcome news of an illegitimacy - examples of which have been discovered in this
particular study- and so these instances need to be treated with cultural and ethical
sensitivity.
Despite the limitations which are found in genetic ancestry testing currently available,
the power and resolution capacity of DNA analyses used in conjunction with traditional
historical research in genealogy will continue to grow. Genetic tests will become more
affordable and more sophisticated, and genetic databases will expand, incorporating
more markers representing a better geographical coverage of global diversity (Jobling,
2015). It must be noted - the finding of matching haplotypes needs careful
interpretation and, in particular, consideration must be taken of the frequency and
resolution of the haplotype in a haplogroup. Ideally, the question of whether a
mismatch is due to mutation, or whether it represents an exclusion of a recent common
ancestor, should be considered in terms of locus-specific mutation rates (Jobling,
2015). It is also crucial to keep in mind how genetic ancestry inference is a biotechnologically assisted process that is based on a socially constructed process, and
101
�the two disciplines should aim to corroborate each other so as to define clearer
ancestral migration and demographic histories.
4.7 Biomedical and forensics impact of population diversity studies
An understanding of how genetic diversity is structured in the human species is not
only of anthropological and political importance, but also of medical relevance
(Jobling, 2000; Lu et al., 2016). Much of the population diversity literature recently
points out that individuals of various cultural and ethnic origins may often respond
differently to medical treatments where major differences in allele frequencies exist
between populations (Wilson et al., 2001; Shriver and Kittles, 2004; Jobling, 2015).
While the majority of polymorphisms investigated in population diversity studies are
probably neutral, they can be used to query for associations with particular phenotypes
and - to examine the reverse - to ask if there are specific phenotypes which influence
the distributions of polymorphisms within populations (Jobling, 2000). The first
approaches to quantifying biological differences were based on crude physical
measurements that were heavily biased in their execution, using characteristics that
define racial classification to which human perception is most directly amenable,
namely phenotypic traits such as skin colour, eye shape and colour, hair colour and
texture, etc. Until much more recently, direct and objective methods of quantifying
genetic variation (as opposed to “physical” characteristics) were non-existent (Lu et
al., 2016).
The first in a series of large public efforts that began to shift the field of medical
genetics away from purely descriptive documentation of patients’ phenotypes, coupled
with ineffective and time-consuming examination of a small subset of patients’
potentially disease-causing genes, was marked by the successful completion of the
Human Genome Project, in 2003 (Lu et al., 2016). Genome-wide association studies
(GWAS) provided the opportunity to efficiently and comprehensively assay genetic
variants common to a population, and to identify those variants more frequent in
patients with a particular disease, than in controls without the disease (Manolio et al.
2009; Lu et al., 2016). Numerous population-specific studies of disease have obtained
conclusive results for population affinity of alleles, which include the investigation of
myocardial infarction in Icelanders, or to prostate cancer in African-Americans, which
102
�have capitalised on the disease-susceptibility of specific alleles in more genetically
homogeneous populations (Jobling and Tyler-Smith, 2000; Lu et al., 2016). Similarly,
the autosomal recessive disease sickle cell anemia, for example, was shown to be
largely restricted to African, Mediterranean, and South Asian populations (Lu et al.,
2016). As early as in 1966 it was already known about another example of populationaffinity for a disease genotype which is that of Ashkenazi Jews, who are statistically
more susceptible to carry the mutant alleles causing autosomal recessive Tay–Sachs
disease (Lu et al., 2016; Myrianthopoulous and Aronson, 1966). Another renowned
case study for treatment response to disease for which there is population specificity
is hepatitis C virus (HCV) infection, for which it was established that African individuals
respond more poorly to HCV drug treatment than Caucasian and Asian individuals (Lu
et al., 2016).
In studies such as these, the appropriate choice of the control population is of intrinsic
importance. While the Y chromosome is highly stratified by geography, it might also
be stratified by other factors such as social-class, which could amount to
ascertainment biases in the attendance of subjects at clinics, as an example. An
approach to this would be to use male, non-blood relatives from within the subjects’
families, as control subjects (Jobling and Tyler-Smith, 2000).
An understanding of population structure is critical for the identification of disease
genes by association with marker loci. Advances in DNA sequencing technologies and
analyses have driven the recent rise of genomics in medicine which is aimed at finding
genetic causes of common complex diseases, so as to develop marketable cures for
them (Lander and Schork, 1994; Cardon and Bell, 2001; Serre and Paabo, 2004;
Bhattacharya 2010; Jobling, 2015; Lu et al., 2016).
In another application of surname/clan-name—genotype association studies, a list of
surnames (clan-names) with associated Y-STR haplotypes could enable a Y profile to
be matched with one or more surnames (clan-names). This might allow the surname
of the depositor of DNA evidence to be deduced, in conjunction with the identification
of genes involved in certain phenotypic traits such as pigmentation, so as to provide a
means to prioritise a suspect list for crime investigation (King and Jobling, 2009).
103
�Y-STR haplotypes will increase the success rate of identifying the male component in
male/female cell mixtures in body fluids where other discrimination methods were
unsuccessful or too risky; for example, highly degraded samples or samples with very
low sperm counts (Kayser et al., 1997).
King and Jobling (2009[b]) proposed that a database of surnames and associated Y
profiles would have forensic utility. However, for more frequent and common names
(those with greater than 6,000 bearers), predictive power is poor, due to high
haplotype diversity. However, for rarer names (those with less than 50 bearers)
databases would be ineffective, as crime-scene samples are relatively unlikely to be
deposited by bearers of these more unique names, so for the most practical reasons
and for optimum efficacy of such a database, a solution would be to incorporate
surnames of intermediate frequency. Regarding a database for forensic utility based
on haplotype-surname relationships, Bhatti et al., (2016) feel that current databases
are not very effective in forensic analysis, due to the currently limited sample size and
unknown geographical ethnic origins of the populations. Further studies need to be
conducted so as to expand and update the current population-specific databases at
ethnic and geographical level by generating a DNA data-set with higher resolutions of
discrimination capacity.
4.8 Social cohesion and making a new South African demographic history
As humans we are all descendants from the same human-species tree. However, still
today we in South Africa observe racial tensions based on the systemic violence,
displacement, racial formation and institutions of social control entrenched by
apartheid, because this enforced separation had resulted in radical racialised notions
of cultural identity. Race has the implied meaning only in the sense that its members
share common ancestry distinct from other groups. Races also share many things
besides genes, to the extent that the concept is inextricably cultural in nature (Kittles
and Weiss, 2003).
People often understand themselves in a capacity of not only what is genetically
inherited, but also in terms of a much more comprehensive set of social relationships,
namely narratives of what is culturally inherited, traditions, attitudes, as well as in terms
of the impact of their childhood and lifelong experiences (Nash, 2006; Bhattacharya,
104
�2010). Genetic genealogy has the power to clarify and reinforce existing
understandings of the significance of ancestry with the public’s sense of identity as
individuals or as members of ethnic groups.
There is a need for social and molecular scientists to step up and dispel myths, by
investigating modest objectives such as confirming relationships between people with
similar surnames to answering specific questions like “what was life like for humans
10,000 years ago?”. This, as well as evaluating oral histories of traditional clans, which
would challenge our perceptions of race, ethnicity and culture. Molecular biology,
when used as a tool coupled with detailed anthropological history, can act to
corroborate and refine demographic history, which for South Africa (and indeed the
world today) can be used to illustrate the arbitrary nature of racial differences which
are insignificant in comparison to much more fundamental commonalities of the
human race.
This study has been in line with such intentions. Through the analyses of the DNA of
current clan descendants in conjunction with genealogical data, certain aspects of the
oral story of the origins of the abeLungu and amaMolo which have survived ten
generations have been affirmed, with other aspects invalidated. With this in mind, we
confirm that molecular (genetic) methods can be used to validate and refine
genealogical history of an example in human history where non-African shipwreck
survivors and immigrants underwent a harmonious integration into a deeply rooted
Xhosa culture, which contrasts with much of South Africa’s recent political history.
105
�CHAPTER 5
Concluding remarks
5.1 Testing the oral history of the abeLungu
Oral history was, and is, a form of entertainment as well as a tool for passing on a
cultural identity and a system of values, the details of which have been added and
subtracted throughout the course of its telling and re-telling. The premise of this study
was to evaluate the congruency of the history passed down from abeLungu
progenitors primarily through the cultural medium of historical and genealogical
narration, by investigating the molecular evidence found in the DNA of its
contemporary clan members.
The genetic data supports the anthropological information regarding introgression of
non-African genes into the gene pool of the abeLungu (Appendix C, Figure S1-, S6).
It has been shown that the DNA narrative is in convincing agreement with the oral
history narrative, which contributes great value to affirming and refining the identity
and culture of the abeLungu people.
Present-day descendants of the abeLungu and the amaMolo exhibit high efficacy in
father/son chromosome transmission, in that they show continuity of transmission of
patrilineal haplotypes in parallel with the transmission of clan name, without dilution
across approximately ten generations (Appendix C, Figures S1-S6). The distinct
feature of tight clustering of the abeLungu ancestral modal-haplotypes with few
variants was consistent for most RMJ networks, which were resistant to repetition of
the analysis with randomised inputs (namely non-clan affiliates from the greater
mPondo region), as suggested in Bandelt et al., (1999).
106
�In addition to affirming the non-african male ancestry of the abeLungu clans, this study
has also demonstrated how the cultural subdivision in patrilineal descent groups has
left its footprints on Y chromosome diversity of patrilocal populations, without affecting
mitochondrial diversity. The male abeLungu population is experiencing a demographic
history of lineal fissions of descent groups without subsequent migrations between
descent groups, and this results in so-called “identity cores” and to a reduction of Y
chromosome diversity (Chaix, 2007). At each generation the female population
undergoes migration flows between lineages of clans, as a result of the social rules of
exogamy in practice in the abeLungu, and therefore obstructs the social structure from
imprinting mitochondrial structure. This presents as an obstacle to investigating the
maternal origins of clan members.
In addition to forming a better understanding of the history of these unique groups of
Xhosa clans who feature foreign origins, a better picture of South Africa’s demographic
history is painted which we can only hope will demonstrate the superficiality of the
antiquated concept of race, provide a greater sense of unity for the future of our
country and provide a deeper understanding of our human origins for our unity as a
species.
As Haraway observes: ‘Epistemophilia, the lusty search for knowledge of origins, is
everywhere’ (Nash, 2004).
107
�References
Abu-amero, K.K., González, A.M., Larruga, J.M. et al., 2007. Eurasian and African
mitochondrial DNA influences in the Saudi Arabian population. BMC Evolutionary
Biology. 15, pp.1–15.
Achilli, A., Rengo, C., Magri, C. et al., 2004. The Molecular Dissection of mtDNA
Haplogroup H Confirms That the Franco-Cantabrian Glacial Refuge Was a Major
Source for the European Gene Pool. American Journal of Human Genetics, 75,
pp.910–918.
Andrews, R.M., Kubacka, I., Chinnery, P. F. et al., 1999. Reanalysis and revision of
the Cambridge reference sequence for human mitochondrial DNA. Nature genetics,
23(2), p.147.
Athey, T.W., 2006. Haplogroup Prediction from Y-STR Values Using a BayesianAllele- Frequency Approach. Journal of Genetic Genealogy. 2(2), pp.34–39.
Ayub, Q., Mohyuddin, A., Qamar, R. et al., 2000. Identification and characterisation of
novel human Y-chromosomal microsatellites from sequence database information.
Nucleic acids research, 28(2), pp.1-5.
Balanovsky, O., Dibirova, K., Dybo, A. et al., 2011. Parallel evolution of genes and
languages in the Caucasus region. Molecular Biology and Evolution, 28(10), pp.2905–
2920.
Balaresque, P., Bowden, G.R., Adams, S.M. et al., 2010. A predominantly neolithic
origin for European paternal lineages. PLoS Biology, 8(1), pp1-9.
Bandelt, H.J., Alves-Silva, J. & Guimaraes, P.E.M., 2001. Phylogeography of the
human mitochondrial haplogroup L3e: a snapshot of African prehistory and Atlantic
slave trade. Annals of human genetics, 65, pp.549–563.
Bandelt, H.J., Forster, P. & Röhl, A., 1999. Median-joining networks for inferring
intraspecific phylogenies. Molecular biology and evolution, 16(1), pp.37–48.
108
�Barik, S.S., Sahani, R., Prasad, B.V.R. et al., 2008. Detailed mtDNA genotypes permit
a reassessment of the settlement and population structure of the Andaman Islands.
American Journal of Physical Anthropology, 136(1), pp.19–27.
Batai, K., Babrowski, K.B., Arroyo, J. P. et al., 2013. Mitochondrial DNA diversity in
two ethnic groups in Southeastern Kenya: Perspectives from the northeastern
periphery of the bantu expansion. American Journal of Physical Anthropology, 150(3),
pp.482–491.
Behar, D.M., Villems, R., Soodyall, H. et al., 2008. The dawn of human matrilineal
diversity. American Journal of Human Genetics, 82(May), pp.1130–1140.
Behar, D.M., Rosset, S., Blue-Smith, J. et al., 2007. The genographic project public
participation mitochondrial DNA database. PLoS Genetics, 3(6), pp.1083–1095.
Behar, D.M., Hammer, M F., Garrigan, D. et al., 2004. MtDNA evidence for a genetic
bottleneck in the early history of the Ashkenazi Jewish population. European journal
of human genetics: EJHG, 12(5), pp.355–364.
Bhattacharya, R., 2010. Human Population Categories in Genomic Studies and
Racialisation. MSc in Race, Ethnicity and Post-Colonial Studies; London School of
Economics and Political Science. pp.1-66
Bhatti, S., Aslamkhan, M., Attimonelli, M. et al., 2016. Mitochondrial DNA variation in
the Sindh population of Pakistan. Australian Journal of Forensic Sciences, 618(May),
pp.1–16.
Bortolini, M-C., Salzano, F.M., Thomas, M.G. et al., 2004. Y-chromosome evidence
for differing ancient demographic histories in the Americas. American journal of human
genetics, 73(3), pp.524–539.
Brotherton, P., Haak, W., Templeton, J. et al., 2013. Europe PMC Funders Group
Neolithic mitochondrial haplogroup H genomes and the genetic origins of Europeans.
Nature Communications, 4:1764, pp.1-21.
109
�Cadenas, A.M., Zhivotovsky, L.A., Cavalli-Sforza, L.L. et al., 2008. Y-chromosome
diversity characterizes the Gulf of Oman. European journal of human genetics: EJHG,
16(3), pp.374–386.
Campbell, K.D., 2007. Geographic Patterns of R1b in the British Isles – Deconstructing
Oppenheimer. Journal of Genetic Genealogy, 3(2), pp.63–71.
Cann, R.L., Stoneking, M. & Wilson, A.C., 1987. Mitochondrial DNA and human
evolution. Nature. 325(1), pp.31-36.
Capelli, C., Brisighelli, F., Scarnicci, F. et al., 2007. Y chromosome genetic variation
in the Italian peninsula is clinal and supports an admixture model for the MesolithicNeolithic encounter. Molecular Phylogenetics and Evolution, 44(1), pp.228–239.
Cardon, L.R. and Bell, I.J., 2001. Association study designs for complex diseases.
Nature reviews. Genetics, 2(2), pp.91–99.
Chaix, R., Quintana-Murci, L., Hegay, T. et al., 2007. From Social to Genetic
Structures in Central Asia. Current Biology, 17(1), pp.43–48.
Chiaroni, J., Underhill, P.A. & Cavalli-Sforza, L.L., 2009. Y chromosome diversity,
human expansion, drift, and cultural evolution. Proceedings of the National Academy
of Sciences of the United States of America, 106(48), pp.20174–20179.
Cinnioǧlu, C., King, R., Kivisild, T. et al., 2004. Excavating Y-chromosome haplotype
strata in Anatolia. Human Genetics, 114(2), pp.127–148.
Crampton, H., 2004. The Sunburnt Queen. Jacana Media Pty (Ltd), 2004. ISBN:
1919931929.
Cruciani, F., La Fratta, R., Santolamazza, P. et al., 2004. Phylogeographic analysis of
haplogroup E3b (E-M215) y chromosomes reveals multiple migratory events within
and out of Africa. American journal of human genetics, 74(5), pp.1014–1022.
Cruciani, F., Santolamazza, P., Shen, P. et al., 2002. A back migration from Asia to
sub-Saharan Africa is supported by high-resolution analysis of human Y-chromosome
haplotypes. American Journal of Human Genetics, 70(5), pp.1197–214.
110
�Destro-Bisol, G., Coia, V., Boschi, I. et al., 2004. The Analysis of Variation of mtDNA
Hypervariable Region I Suggests that Eastern and Western Pygmies Diverged before
the Bantu Expansion. The American Naturalist, 163(2), pp.212–226.
Di Gaetano, C. et al., Cerutti, N. & Crobu, F. 2009. Differential Greek and northern
African migrations to Sicily are supported by genetic evidence from the Y
chromosome. European journal of human genetics: EJHG, 17(1), pp.91–99.
Di Giacomo, F., Luca, F., Popa, L.O. et al., 2004. Y chromosomal haplogroup J as a
signature of the post-neolithic colonization of Europe. Human Genetics, 115(5),
pp.357–371.
Doosti, A. & Dehkordi, P., 2011. Genetic Polymorphisms of Mitochondrial Genome Dloop Region in Bakhtiarian Population by PCR-RFLP. International Journal of Biology,
3(4), pp.41–46.
Fadhlaoui-Zid, K., Plaza, S., Calafell, F. et al., 2004. Mitochondrial DNA heterogeneity
in Tunisian Berbers. Annals of Human Genetics, 68(3), pp.222–233.
Fejerman, L., Carnese, F.R., Goicoechea, A.S. et al., 2005. African ancestry of the
population of Buenos Aires. American Journal of Physical Anthropology, 128(1),
pp.164–170.
Finnilä, S., Lehtonen, M.S., Majamaa, K. et al., 2001. Phylogenetic Network for
European mtDNA. The American Journal of Human Genetics, 68(6), pp.1475–1484.
Forster, P., Röhl, A., Lünnemann, P. et al., 2000. A short tandem repeat-based
phylogeny for the human Y chromosome. American journal of human genetics, 67(1),
pp.182–196.
Freire-Marreco, B., 1914. Tewa Kinship terms from the Pueblo of Hano, Arizona.
American Anthropologist, N.S (16) pp.269-287.
Fu, Q., Rudan, P., Paabo, S. et al., 2012. A next-generation approach to the
characterization of a non-model plant transcriptome. Current Science, 101(11),
pp.1435–1439.
111
�Geppert, M. and Roewer, L., 2012. SNaPshot® Minisequencing Analysis of Multiple
Ancestry-Informative Y-SNPs Using Capillary Electrophoresis. DNA Electrophoresis
Protocols for Forensic Genetics, Vol. 830, pp. 127-140
Gonder, M.K., Mortensen, H.M., Reed, F.A. et al., 2007. Whole-mtDNA genome
sequence analysis of ancient African lineages. Molecular Biology and Evolution, 24(3),
pp.757–768.
Gray, I.C., Campbell, D.A. & Spurr, N.K., 2000. Single nucleotide polymorphisms as
tools in human genetics. Human molecular genetics, 9(16), pp.2403–2408.
Green, R.E., Malaspinas, A.S., Krause, J. et al., 2008. A Complete Neandertal
Mitochondrial Genome Sequence Determined by High-Throughput Sequencing. Cell,
134(3), pp.416–426.
Green, R.E., Krause, J., Briggs, A.W. et al., 2010. A draft sequence of the Neandertal
genome. Science (New York, N.Y.), 328(5979), pp.710–22.
Hage, P. & Marck, J., 2003. Matrilineality and the Melanesian Origin of Polynesian Y
Chromosomes. Current Anthropology, 44(S5), pp. S121–S127.
Hall, T.A., 1999. BioEdit: a user-friendly biological sequence alignment editor and
analysis program for Windows 95/98/NT. Nucleic acids Symposium, pp.95–98.
Hammer, M.F., Behar, D.M., Karafet, T.M. et al., 2009. Extended y chromosome
haplotypes resolve multiple and unique lineages of the Jewish priesthood. Human
Genetics, 126(5), pp.707–717.
Hammer, M.F. & Zegura, S.L., 2002. The Human Y Chromosome Haplogroup Tree:
Nomenclature and Phylogeography of Its Major Divisions. Annual Review of
Anthropology, 31(1), pp.303–321.
Hinds, D.A., Stuve, L.L., Nilsen, G.B. et al., 2005. Whole-genome patterns of common
DNA variation in three human populations. Science (New York, N.Y.), 307(5712),
pp.1072–1079.
Iborra, F.J., Kimura, H. & Cook, P.R., 2004. The functional organization of
mitochondrial genomes in human cells. BMC biology, 2(9), pp.1–14.
112
�Järve, M., Zhivotovsky, L.A., Rootsi, S. et al., 2009. Decreased rate of evolution in Y
chromosome STR loci of increased size of the repeat unit. PLoS ONE, 4(9).
Jobling, M.A., 2001. In the Name of the Father. Trends in Genetics, 17(6), pp.353–
357.
Jobling, M.A., Rasteiro, R. & Wetton, J.H., 2015. In the blood: the myth and reality of
genetic markers of identity. Ethnic and Racial Studies, 39(2), pp.142–161.
Jobling, M.A. & Tyler-Smith, C., 2000. New uses for new haplotypes. Trends in
Genetics, 16(8), pp.356–362.
Jobling, M.A. & Tyler-Smith, C., 2003. The human Y chromosome: an evolutionary
marker comes of age. Nature reviews. Genetics, 4(8), pp.598–612.
Jorde, L.B., Bamshad, M. & Rogers, A.R., 1998. Using mitochondrial and nuclear DNA
markers to reconstruct human evolution. BioEssays: news and reviews in molecular,
cellular and developmental biology, 20(2), pp.126–136.
Jorde, L.B., Watkins, W.S., Bamshad, M.J. et al., 2000. The distribution of human
genetic diversity: a comparison of mitochondrial, autosomal, and Y-chromosome data.
American journal of human genetics, 66(3), pp.979–988.
Karafet, T.M., Mendez, F.L., Meilerman, M.B. et al., 2008. New binary polymorphisms
reshape and increase resolution of the human Y chromosomal haplogroup tree.
Genome Research, 18(5), pp.830–838.
Kayser, M., Cagliá, A. & Fretwell, N., 1997. Evaluation of Y-chromosomal STRs: a
multicenter study. International Journal of Biology, pp.125–133.
Kayser, M. et al., 2000. Characteristics and frequency of germline mutations at
microsatellite loci from the human Y chromosome, as revealed by direct observation
in father/son pairs. American journal of human genetics, 66(5), pp.1580–1588.
Kayser, M., Roewer, L., Hedman, M. et al., 2003. Reduced Y-chromosome, but not
mitochondrial DNA, diversity in human populations from West New Guinea. American
journal of human genetics, 72(2), pp.281–302.
113
�King, T.E. & Jobling, M.A., 2009. What’s in a name? Y chromosomes, surnames and
the genetic genealogy revolution. Trends in Genetics, 25(8), pp.351–360.
King, T.E. & Jobling, M.A., 2009. Founders, drift, and infidelity: The relationship
between y chromosome diversity and patrilineal surnames. Molecular Biology and
Evolution, 26(5), pp.1093–1102.
Kirby, P.R., 1953. A Source Book on the Wreck of the Grosvenor East Indianman.
Volume 34 of Van Riebeck Society publications. First series, 1953.
Kivisild, T. et al., 2004. Ethiopian mitochondrial DNA heritage: tracking gene flow
across and around the gate of tears. American journal of human genetics, 75(5),
pp.752–770.
Kivisild, T., Reidla, M., Metspalu, E. et al., 2002. The Genetics of Language and
Farming Spread in India. In Examining the farming/language dispersal hypothesis.
McDonald Institute Monographs, ISBN: 1902937201. Chpt. 17. pp. 215–222.
Klyosov, A., 2009. DNA Genealogy, Mutation Rates, and Some Historical Evidence
Written in the Y-Chromosome, Part II: Walking the Map, Journal of Genetic
Genealogy, 5(2), pp.217-256
Klyosov, A.A. & Rozhanskii, I.L., 2012. Haplogroup R1a as the Proto Indo-Europeans
and the Legendary Aryans as Witnessed by the DNA of Their Current Descendants.
Advances in Anthropology, 02(01), pp.1–13.
Knight, A., Underhill, P.A., Mortensen, H.M. et al., 2003. African Y chromosome and
mtDNA divergence provides insight into the history of click languages. Current
Biology, 13(6), pp.464–473.
Lacau, H., Gayden, T., Regueiro, M. et al., 2012. Afghanistan from a Y-chromosome
perspective. European Journal of Human Genetics, 20(10), pp.1063–1070.
Lander, E. & Schork, N.J., 1996. Genetic dissection of complex traits. Nature genetics,
12(4), pp.355–356.
114
�Loogvali, E.L., Roostalu, U., Malyarchuk, B.A. et al., 2004. Disuniting uniformity: A
pied cladistic canvas of mtDNA haplogroup H in Eurasia. Molecular Biology and
Evolution, 21(11), pp.2012–2021.
Lu, Y., Goldstein, D.B., Angrist, M. et al., 2016. Personalized Medicine and Human
Genetic Diversity. Cold Spring Harbor Perspectives in Medicine, 4(9), pp.1-11.
Macaulay, V., Richards, M., Hickey, E. et al., 1999. The emerging tree of West
Eurasian mtDNAs: a synthesis of control-region sequences and RFLPs. American
journal of human genetics, 64(1), pp.232–49.
Manolio, T.A., Collins, F.S. & Cox, N.J., 2009. Finding the missing heritability of
complex diseases. Nature, 461(8), pp.747–753.
McEvoy, B. & Bradley, D.G., 2006. Y-chromosomes and the extent of patrilineal
ancestry in Irish surnames. Human Genetics, 119(1-2), pp.212–219.
McEvoy, B., Simms, K. & Bradley, D.G., 2008. Genetic investigation of the patrilineal
kinship structure of early medieval Ireland. American Journal of Physical
Anthropology, 136(4), pp.415–422.
Montinaro, F., Davies, J. & Capelli, C., 2016. Group membership, geography and
shared ancestry: Genetic variation in the Basotho of Lesotho. American Journal of
Physical Anthropology, 160(1), pp.156–161.
Moore, L.T., McEvoy, B., Cape, E. et al., 2006. A Y-chromosome signature of
hegemony in Gaelic Ireland. American journal of human genetics, 78(2), pp.334–338.
Msaidie, S., Ducourneau, A., Boetsch, G. et al., 2010. Genetic diversity on the
Comoros Islands shows early seafaring as major determinant of human biocultural
evolution in the Western Indian Ocean. European journal of human genetics: EJHG,
19(1), pp.89–94.
Mulero, J.J., Chang, C.W., Calandro, L. M. et al., 2006. Development and validation
of the AmpFℓSTR® YfilerTM PCR amplification kit: A male specific, single amplification
17 Y-STR multiplex system. Journal of Forensic Sciences, 51(1), pp.64–75.
115
�Myres, N.M., Rootsi, S., Lin, A.A. et al., 2011. A major Y-chromosome haplogroup R1b
Holocene era founder effect in Central and Western Europe. European journal of
human genetics: EJHG, 19(1), pp.95–101.
Myrianthopoulos, N.C. & Aronson, S.M., 1966. Population dynamics of Tay-Sachs
disease. I. Reproductive fitness and selection. American Journal of Human Genetics,
18(4), pp.313–327.
Naidoo, T., Schlebusch, C.M., Makkan, H. et al., 2010. Development of a single base
extension method to resolve Y chromosome haplogroups in sub-Saharan African
populations. Investigative genetics, 1(1), p.6.
Nash, C., 2004. Genetic kinship. Cultural Studies, 18(1), pp.1–33.
Nash, C., 2006. Genetic tests for genealogy - 10 reasons to be wary. L’Observatoire
de la genetique, 29(Sept-Oct).
Nebel, A., Filon, D., Brinkmann, B. et al., 2001. The Y chromosome pool of Jews as
part of the genetic landscape of the Middle East. American journal of human genetics,
69(5), pp.1095–1112.
Pääbo, S., Poinar, H., Serre, D. et al., 2004. Genetic analyses from ancient DNA. Annu
Rev Genet, 38, pp.645–79.
Pamjav, H., Zalán, A., Béres, J. et al., 2011. Genetic structure of the paternal lineage
of the Roma People. American Journal of Physical Anthropology, 145(1), pp.21–29.
Phillips, C., Salas, A., Sánchez, J. J. et al., 2007. Inferring ancestral origin using a
single multiplex assay of ancestry-informative marker SNPs. Forensic Science
International: Genetics, 1(3-4), pp.273–280.
Plaza, S., Salas, A., Calafell, F. et al., 2004. Insights into the western Bantu dispersal:
mtDNA lineage analysis in Angola. Human Genetics, 115(5), pp.439–447.
Preston-Whyte, E., 1974. Reproductive health and the condom dilemma: identifying
situational barriers to HIV protection in South Africa. Resistances to Behavioural
Change to Reduce HIV/AIDS Infection, C, pp.139–155.
116
�Pritchard, J.K., 2001. Are rare variants responsible for susceptibility to complex
diseases? American journal of human genetics, 69(1), pp.124–137.
Qamar, R., Ayub, Q., Mohyuddin, A. et al., 2002. Y-chromosomal DNA variation in
Pakistan. American journal of human genetics, 70(5), pp.1107–1124.
Quintana-Murci, L., Chaix, R., Wells, S.R. et al., 2004. Where west meets east: the
complex mtDNA landscape of the southwest and Central Asian corridor. American
journal of human genetics, 74(5), pp.827–845.
Raghavan, M., Skoglund, P., Graf, K.E. et al., 2014. Upper Palaeolithic Siberian
genome reveals dual ancestry of Native Americans. Nature, 505(7481), pp.87–91.
Ralph, P. & Coop, G., 2013. The Geography of Recent Genetic Ancestry across
Europe. PLoS Biology, 11(5).
Ramakrishnan, U. & Mountain, J.L., 2004. Precision and accuracy of divergence time
estimates from STR and SNPSTR variation. Molecular Biology and Evolution, 21(10),
pp.1960–1971.
Redd, A.J., Agellon, A.B., Kearney, V.A. et al., 2002. Forensic value of 14 novel STRs
on the human Y chromosome. Forensic Science International, 130(2-3), pp.97–111.
Regueiro, M., Rivera, L., Chennakrishnaiah, S. et al., 2012. Ancestral modal Y-STR
haplotype shared among Romani and South Indian populations. Gene, 504(2),
pp.296–302.
Richards, M.B., Macaulay, V.A., Bandelt, H.J. et al., 1998. Phylogeography of
mitochondrial DNA in western Europe. Annals of human genetics, 62(Pt 3), pp.241–
260.
Richards, M., Macaulay, V., Hickey, E. et al., 2000. Tracing European founder lineages
in the Near Eastern mtDNA pool. American journal of human genetics, 67(5), pp.1251–
1276.
Roewer, L., Krawczak, M., Willuweit, S. et al., 2001. Online reference database of
European Y-chromosomal short tandem repeat (STR) haplotypes. Forensic Science
International, 118(2-3), pp.106–113.
117
�Roewer, L., 2009. Y chromosome STR typing in crime casework. Forensic Science,
Medicine, and Pathology, 5(2), pp.77–84.
Roewer, L., Willuweit, S., Krüger, C. et al., 2008. Analysis of Y chromosome STR
haplotypes in the European part of Russia reveals high diversities but non-significant
genetic distances between populations. International Journal of Legal Medicine,
122(3), pp.219–223.
Rosser, Z.H., Zerjal, T., Hurles, M.E. et al., 2000. Y-chromosomal diversity in Europe
is clinal and influenced primarily by geography, rather than by language. American
Journal of Human Genetics, 67(6), pp.1526–1543.
Sahoo, S., Singh, A., Himabindu, G. et al., 2006. A prehistory of Indian Y
chromosomes: evaluating demic diffusion scenarios. Proceedings of the National
Academy of Sciences of the United States of America, 103(4), pp.843–848.
Salas, A., Richards, M., De la Fe, T. et al., 2002. The making of the African mtDNA
landscape. American Journal of Human Genetics, The, 71(5), pp.1082–111.
Sanchez-Faddeev, H., Pijpe, J., van der Hulle, T. et al., 2013. The influence of clan
structure on the genetic variation in a single Ghanaian village. European Journal of
Human Genetics, 21(10), pp.1134–1139.
Scheffler, I.E., 2000. A century of mitochondrial research: Achievements and
perspectives. Mitochondrion, 1(1), pp.3–31.
Schlebusch, C.M., Naidoo, T. & Soodyall, H., 2009. SNaPshot minisequencing to
resolve mitochondrial macro-haplogroups found in Africa. Electrophoresis, 30(21),
pp.3657–3664.
Schlebusch, C.M., de Jongh, M. & Soodyall, H., 2011. Different contributions of
ancient mitochondrial and Y-chromosomal lineages in “Karretjie people” of the Great
Karoo in South Africa. Journal of Human Genetics, 56(9), pp.623–630.
Semino, O. et al., 2000. The genetic legacy of Paleolithic Homo sapiens sapiens in
extant Europeans: a Y chromosome perspective. Science (New York, N.Y.),
290(5494), pp.1155–1159.
118
�Semino, O., Passarino, G., Oefner, P.J. et al., 2004. Origin, diffusion, and
differentiation of Y-chromosome haplogroups E and J: inferences on the neolithization
of Europe and later migratory events in the Mediterranean area. American journal of
human genetics, 74(5), pp.1023–1034.
Semino, O., Santachiara-Benerecetti, A.S., Falaschi, F. et al., 2002. Ethiopians and
Khoisan share the deepest clades of the human Y-chromosome phylogeny. American
journal of human genetics, 70(1), pp.265–268.
Sengupta, S., Zhivotovsky, L.A., King, R. et al., 2006. Polarity and temporality of highresolution Y-chromosome distributions in India identify both indigenous and
exogenous expansions and reveal minor genetic influence of Central Asian
pastoralists. American journal of human genetics, 78(2), pp.202–221.
Serre, D. & Pääbo, S., 2004. Evidence for gradients of human genetic diversity within
and among continents. Genome Research, 14(9), pp.1679–1685.
Shriver, M.D. & Kittles, R.A., 2004. Genetic ancestry and the search for personalized
genetic histories. Nature reviews. Genetics, 5(8), pp.611–618.
Simoni, L., Calafell, F., Pettener, D. et al., 2000. Geographic patterns of mtDNA
diversity in Europe. American journal of human genetics, 66(1), pp.262–278.
Soares, P., Alshamali, F.,Pereira, J.B. et al., 2011. The expansion of mtDNA
haplogroup L3 within and out of Africa. Molecular Biology and Evolution, 29(3),
pp.915–927.
Soga, J., 1930. The South-Eastern Bantu. Cambridge University Press, 2013. ISBN:
1108066828,
Soodyall, H., 2013. Lemba origins revisited: Tracing the ancestry of Y chromosomes
in South African and Zimbabwean Lemba. South African Medical Journal,
103(SUPPL. 1), pp.1009–1013.
Soodyall, H. & Schlebusch, C.M., 2010. The genetic landscape of sub-Saharan
African populations, unpublished, pp.1-34
119
�Stark, A., 2013. The Matrilineal System of the Minangkabau and its Persistence
Throughout History: A Structural Perspective - the Minangkabau society. Southeast
Asia: A Multidisciplinary Journal, 13, pp.1–13.
Sykes,
B. 2001. The
seven
daughters of
Eve. Tandem Library,
2002.
ISBN:1417625929
Tamura, K., Dudley, J., Nei, M. et al., 2007. MEGA4: Molecular Evolutionary Genetics
Analysis (MEGA) software version 4.0. Molecular Biology and Evolution, 24(8),
pp.1596–1599.
Thanseem, I., Thangaraj, K., Chaubey, G. et al., 2006. Genetic affinities among the
lower castes and tribal groups of India: inference from Y chromosome and
mitochondrial DNA. BMC genetics, 7(42), p.42.
Taylor, S. 2005. The Caliban Shore. Faber & Faber, 2012. ISBN: 0571295673
Tishkoff, S.A., Gonder, M.K., Henn, B.M. et al., 2007. History of click-speaking
populations of Africa inferred from mtDNA and Y chromosome genetic variation.
Molecular Biology and Evolution, 24(10), pp.2180–2195.
Torroni, A., Lott, M.T., Cabell, M.F. et al., 1994. mtDNA and the origin of Caucasians:
Identification of ancient Caucasian- specific haplogroups, one of which is prone to a
recurrent somatic duplication in the D-loop region. American Journal of Human
Genetics, 55(4), pp.760–776.
Torroni, A., Rengo, C., Guida, V. et al., 2001. Do the four clades of the mtDNA
haplogroup L2 evolve at different rates? American journal of human genetics, 69(6),
pp.1348–1356.
Torroni, A., Huoponen, K., Francalacci, P. et al., 1996. Classification of European
mtDNAs from an analysis of three European populations. Genetics, 144(4), pp.1835–
1850.
Underhill, P.A., Passarino, G., Lin, A.A.
et al., 2001. The phylogeography of Y
chromosome binary haplotypes and the origins of modern human populations. Annals
of human genetics, 65(Pt 1), pp.43–62.
120
�Underhill, P.A., Shen, P., Lin, A.A. et al., 2000. Y chromosome sequence variation and
the history of human populations. Nature genetics, 26(3), pp.358–361.
Underhill, P.A., Myres, N.M., Rootsi, S. et al., 2010. Separating the post-Glacial
coancestry of European and Asian Y chromosomes within haplogroup R1a. European
journal of human genetics: EJHG, 18(4), pp.479–484.
van Oven, M. & Kayser, M., 2009. Updated comprehensive phylogenetic tree of global
human mitochondrial DNA variation. Human mutation, 30(2), pp.386–394.
Varzari, A., Kharkov, V., Nikitin, A.G. et al., 2013. Paleo-Balkan and Slavic
Contributions to the Genetic Pool of Moldavians: Insights from the Y Chromosome.
PLoS ONE, 8(1), pp.1–9.
Vigilant, L. et al., 1989. Mitochondrial DNA sequences in single hairs from a southern
African population. Proceedings of the National Academy of Sciences of the United
States of America, 86(December), pp.9350–9354.
Westen, A.A., Westen, A.A., Kraaijenbrink, T. et al., 2015. Analysis of 36 Y-STR
marker units including a concordance study among 2085 Dutch males. Forensic
Science International: Genetics, 14, pp.174–181.
Willuweit, S. & Roewer, L., 2007. Y chromosome haplotype reference database
(YHRD): Update. Forensic Science International: Genetics, 1(2), pp.83–87.
Wilson, J.F., Weale, M.E., Smith, A.C. et al., 2001. Population genetic structure of
variable drug response. Nature genetics, 29(3), pp.265–269.
Wu, W., Pan, L., Hao, H. et al., 2010. Population genetics of 17 Y-STR loci in a large
Chinese Han population from Zhejiang Province, Eastern China. Forensic Science
International: Genetics, 5(1), pp.2009–2011.
Young, L.S. & Jackson, C., 2011. ‘Bhuti’: Meaning and Masculinities in Xhosa
Brothering. Journal of Psychology in Africa, 21(2), pp.221–228.
Zalloua, P.A., Platt, D.E., El Sibai, M. et al., 2008. Identifying Genetic Traces of
Historical Expansions: Phoenician Footprints in the Mediterranean. American Journal
of Human Genetics, 83(5), pp.633–642.
121
�Zegura, S.L., Karafet, T.M., Zhivotovsky, L.A. et al., 2004. High-Resolution SNPs and
Microsatellite Haplotypes Point to a Single, Recent Entry of Native American Y
Chromosomes into the Americas. Molecular Biology and Evolution, 21(1), pp.164–
175.
Zhivotovsky, L.A., Underhill, P.A, Cinnioğlu, C. et al., 2004. The effective mutation rate
at Y chromosome short tandem repeats, with application to human populationdivergence time. American journal of human genetics, 74(1), pp.50–61.
Online references:
1. Hayward-Kalis,
J.
2006.
History
of
Pondoland
http://www.portstjohns.org.za/history-pondoland.html
Copyright
(Transkei)
c
2006-2010
portstjohns.org.za. Accessed August, 2011.
2. Zinto. 2007. Blood ties between Slaves, Europeans & Xhosa in the Cape
http://slaveryincapetown.blogspot.com/2007/02/blood-ties-between-slaveseuropeans.html. Accessed June, 2012.
3. The Mito Blog - ALL ABOUT MITOCHONDRIA! https://themitoblog.wordpress.com/tag/mitochondria-blog/ Last accessed
February, 2016
4. International Society of Genetic Genealogy (2016). Y-DNA Haplogroup Tree 2016,
Version: 11.298, 31 October 2016, http://www.isogg.org/tree/ [Date of last access:
June, 2016].
5. J.D
MacDonald
-
the
MacDonald
family
name
reference
database
<http://www.scs.illinois.edu/~mcdonald>. Accessed April, 2016
6. Irish surname/haplotype reference database: http://www.irishtype3dna.org/
Accessed April, 2016.
122
�APPENDICES
123
�Appendix A : Ethics
124
�Appendix B: SNP-marker panels for SBE multiplex assays
Table S1
125
�Table S1 continued
126
�Appendix C: Clan genealogies
Figures S1 – S6 are the partial genealogies of the 13 clan families. The legend bellow
describes the symbols found in the clan genealogy diagrams:
Clan-affiliated individuals that are part of the sample set are demarcated with a sample
code (UMT prefix) and their unique haplotype, while the remainder of the individuals
in the genealogies are demarcated by a numbering system where the roman numeral
indicates a particular generation, and the subsequent
numbers designate the
particular individual within that generation.
Note: The amaMolo and abeLungu Jekwa genealogies (Figures S1 & S2) have been
split and resized as opposed to having featured them in landscape orientation on the
page, so as to illustrate them with an optimal aspect ratio.
127
�Figure S1 - The amaMolo clan genealogy featuring the distinctive Bhayi haplogroup R1a1a
(R-M198)] lineage and the Pita [haplogroup Q (Q-M242)] lineage
128
�Figure S2 - The abeLungu Jekwa clan genealogy featuring the modal haplotype R343_5
and variant lineages. The two NPTs are demarcated in red squares
129
�Figure S3 - The abeLungu Caine and Horner clan genealogies
130
�Figure S4 - The abeLungu Hatu clan genealogy
131
�Figure S5 - The abeLungu Ogle, Irish, France, Buku and Thaka clan genealogies
132
�Figure S6 - The abeLungu Fuzwayo, Hastoni and Sukwini clan genealogies featuring African
haplotypes
133
�Appendix D: Variant sites of unique mtDNA haplotypes
Table S2
HG
HT
HT
HVR1 Variant Sites
HVR2 Variant Sites
freq.
L0a1b
1a
2
16129A, 16148T, 16168T, 16172C, 16187T,
73G, 146C, 152C, 195C, 247A
16188G, 16189C, 16223T, 16230G, 16278T,
16293G, 16311C, 16320T
1b
1
16129A, 16148T, 16168T, 16172C, 16187T,
73G, 146C, 152C, 195C, 263G
16188G, 16189C, 16223T, 16230G, 16278T,
16293G, 16311C, 16320T
1c
1
16129A, 16148T, 16168T, 16172C, 16187T,
73G, 150T, 185A, 189G, 263G
16188G, 16189C, 16223T, 16230G, 16278T,
16293G, 16311C, 16320T
1d
1
16129A, 16148T, 16168T, 16172C, 16187T,
73G, 185A, 236C, 247A, 263G
16188G, 16189C, 16223T, 16230G, 16278T,
16293G, 16311C, 16320T
1e
1
16129A, 16148T, 16168T, 16172C, 16187T,
73G, 95C, 189G, 198T, 247A, 263G
16188G, 16189C, 16223T, 16230G, 16278T,
16293G, 16311C, 16320T
1f
1
16129A, 16148T, 16168T, 16172C, 16187T,
89C, 93G, 95C, 185A, 189G, 236C,
16188G, 16189C, 16223T, 16230G, 16278T,
247A, 263G
16293G, 16311C, 16320T
1g
2
16129A, 16148T, 16168T, 16172C, 16187T,
93G, 95C, 185A, 189G, 236C,
16188G, 16189C, 16223T, 16230G, 16278T,
247A, 263G
16293G, 16311C, 16320T
1h
1
16129A, 16148T, 16168T, 16172C, 16187T,
93G, 95C, 185A, 189G, 236C,
16188G, 16189C, 16223T, 16230G, 16278T,
247A, 263G
16293G, 16311C, 16320T, 16519C
1i
1
16129A, 16148T, 16168T, 16172C, 16188G,
93G, 95C, 185A, 189G, 236C,
16189C, 16223T, 16230G, 16278T, 16293G,
247A, 263G
16311C, 16320T
L0a2a2 2a
2b
2
1
16129A, 16148T, 16169T, 16172C, 16187T,
93G, 146C, 150T, 185A, 189G,
16188A, 16189C, 16223T, 16230G, 16261T,
195C, 204C, 207A, 236C, 247A,
16278T, 16311C, 16320T, 16519C
263G
16148T, 16172C, 16187T, 16188G, 16189C,
93G, 152C, 189G, 204C, 207A,
16223T, 16230G, 16311C, 16320T
236C, 247A, 263G
134
�2c
2d
2e
2
1
1
16148T, 16172C, 16187T, 16188G, 16189C,
64T, 93G, 152C, 189G, 204C,
16223T, 16230G, 16311C, 16320T, 16519C
207A, 236C, 247A, 263G
16148T, 16172C, 16187T, 16188G, 16189C,
73G, 150T, 185A, 189G, 195C,
16223T, 16230G, 16311C, 16320T, 16519C
263G
16148T, 16172C, 16187T, 16188G, 16189C,
73G, 152C, 195C, 263G
16223T, 16230G, 16311C, 16320T, 16519C
2f
1
16148T, 16172C, 16187T, 16188G, 16189C,
73G, 93G, 146C, 150T, 152C,
16223T, 16230G, 16311C, 16320T, 16519C
182T, 183G, 195C, 198T, 263G,
325T
2g
L0d1a
3a
1
1
16148T, 16172C, 16187T, 16188G, 16189C,
73G, 93G, 152C, 189G, 204C,
16223T, 16230G, 16311C, 16320T, 16519C
207A, 236C, 247A, 263G
16129A, 16187T, 16189C, 16209C, 16230G,
73G, 146C, 153G, 199C, 247A
16234T, 16243C, 16266A, 16311C, 16519C
3b
3c
1
1
16129A, 16187T, 16189C, 16230G, 16234T,
73G, 146C, 152C, 199C, 247A,
16243C, 16266A, 16284G, 16311C, 16519C
310C, 311T
16129A, 16187T, 16189C, 16230G, 16234T,
73G, 150T, 185A, 189G, 263G
16243C, 16266A, 16284G, 16311C, 16519C
3d
1
16129A, 16187T, 16189C, 16230G, 16234T,
73G, 146C, 195C, 199C, 247A
16243C, 16266A, 16311C, 16464C, 16519C
3e
2
16129A, 16187T, 16189C, 16230G, 16234T,
73G, 146C, 152C, 199C, 247A
16243C, 16266A, 16311C, 16519C
3f
3
16129A, 16187T, 16189C, 16230G, 16234T,
73G, 146C, 195C, 199C, 247A
16243C, 16266A, 16311C, 16519C
3g
3h
1
1
16129A, 16187T, 16189C, 16230G, 16234T,
73G, 146C, 195C, 199C, 247A,
16243C, 16266A, 16311C, 16519C
318C
16129A, 16187T, 16189C, 16230G, 16234T,
73G, 150T, 195C, 263G
16243C, 16266A, 16311C, 16519C
3i
1
16129A, 16187T, 16189C, 16230G, 16234T,
73G, 185A, 236C, 247A, 263G
16243C, 16266A, 16311C, 16519C
3j
1
16129A, 16187T, 16189C, 16230G, 16234T,
93G, 146C, 150T, 185A, 189G,
16243C, 16266A, 16311C, 16519C
195C, 204C, 207A, 236C, 247A,
263G
3k
1
16129A, 16187T, 16189C, 16230G, 16234T,
73G, 146C, 195C, 199C, 247A
16243C, 16266T, 16311C, 16318T, 16519C
3l
1
16187T, 16189C, 16223T, 16230G, 16234T,
73G, 146C, 152C, 195C, 247A
16243C, 16249C, 16311C, 16519C
135
�L0d1b
4a
1
16129A, 16187T, 16189C, 16218T, 16223T,
73G, 146C, 152C, 195C, 247A
16227G, 16239T, 16243C, 16294T, 16311C,
16478G, 16519C
4b
2
16129A, 16187T, 16189C, 16218T, 16223T,
73G, 146C, 152C, 195C, 247A
16239T, 16243C, 16294T, 16311C, 16519C
L0d2a
5a
1
16093C, 16129A, 16187T, 16189C, 16212G,
73G, 146C, 152C, 195C, 198T,
16223T, 16230G, 16243C, 16311C, 16390A,
247A
16519C
5b
1
16129A, 16145A, 16187T, 16189C, 16212G,
73G, 146C, 152C, 195C, 198T,
16223T, 16230G, 16243C, 16311C, 16390A,
247A
16519C, 16524G
5c
1
16129A, 16154G, 16187T, 16189C, 16212G,
73G, 146C, 152C, 195C, 198T,
16223T, 16230G, 16243C, 16311C, 16390A,
247A
16519C
5d
1
16129A, 16179T, 16187T, 16189C, 16212G,
73G, 146C, 152C, 195C, 198T,
16223T, 16230G, 16243C, 16311C, 16390A,
247A
16519C
5e
4
16129A, 16187T, 16188G, 16189A, 16212G,
73G, 146C, 152C, 195C, 198T,
16223T, 16230G, 16243C, 16311C, 16390A,
247A
16519C
5f
1
16129A, 16187T, 16189C, 16212G, 16221T,
73G, 146C, 195C, 199C, 247A
16223T, 16230G, 16243C, 16311C, 16390A,
16519C
5g
2
16129A, 16187T, 16189C, 16212G, 16223T,
73G, 146C, 152C, 195C, 198T,
16230G, 16243C, 16311C, 16320T, 16390A,
247A
16519C
5h
5i
5j
5k
5l
1
1
11
1
1
16129A, 16187T, 16189C, 16212G, 16223T,
185A, 189G, 236C, 247A, 263G,
16230G, 16243C, 16311C, 16390A, 16519C
324G, 348G
16129A, 16187T, 16189C, 16212G, 16223T,
73G, 146C, 152C, 195C, 198T,
16230G, 16243C, 16311C, 16390A, 16519C
227G, 247A
16129A, 16187T, 16189C, 16212G, 16223T,
73G, 146C, 152C, 195C, 198T,
16230G, 16243C, 16311C, 16390A, 16519C
247A
16129A, 16187T, 16189C, 16212G, 16223T,
73G, 146C, 152C, 199C, 247A,
16230G, 16243C, 16311C, 16390A, 16519C
310C, 311T
16129A, 16187T, 16189C, 16212G, 16223T,
73G, 146C, 153G, 199C, 247A
16230G, 16243C, 16311C, 16390A, 16519C
136
�5m
1
16129A, 16187T, 16189C, 16212G, 16223T,
73G, 150T, 185A, 189G, 263G
16230G, 16243C, 16311C, 16390A, 16519C
5n
1
16129A, 16187T, 16189C, 16212G, 16223T,
73G, 150T, 195C, 263G
16230G, 16243C, 16311C, 16390A, 16519C
5o
5p
1
1
16129A, 16187T, 16189C, 16212G, 16223T,
73G, 93G, 146C, 152C, 195C,
16230G, 16243C, 16311C, 16390A, 16519C
236C, 247A, 263G
16129A, 16187T, 16189C, 16212G, 16223T,
73G, 146C, 152C, 195C, 198T,
16230G, 16243C, 16311C, 16390A, 16519C,
247A
16549G
5q
5r
1
1
16129A, 16187T, 16189C, 16223T, 16230G,
73G, 146C, 152C, 195C, 198T,
16239T, 16243C, 16294T, 16311C, 16519C
247A
16129A, 16187T, 16189C, 16223T, 16230G,
73G, 146C, 152C, 195C, 247A
16239T, 16243C, 16294T, 16311C, 16519C
5s
1
16129A, 16187T, 16189C, 16223T, 16230G,
73G, 150T, 195C, 263G
16239T, 16243C, 16294T, 16311C, 16519C
5t
1
16129A, 16187T, 16189C, 16223T, 16239T,
73G, 146C, 152C, 195C, 247A
16243C, 16294T, 16311C, 16519C
L0d2b
6a
2
16069T, 16126C, 16129A, 16169T, 16182C,
73G, 146C, 195C, 247A, 265C
16183C, 16189C, 16212G, 16223T, 16230G,
16243C, 16258C, 16291T, 16311C, 16519C
L0d2c
7a
1
16129A, 16187T, 16189C, 16223T, 16230G,
73G, 146C, 195C, 247A, 294A
16243C, 16311C, 16519C
L0d3
8a
1
16187T, 16189C, 16223T, 16230G, 16243C,
73G, 146C, 150T, 195C, 247A
16256T, 16274A, 16278T, 16290T, 16300G,
16311C, 16362C, 16519C
8b
1
16187T, 16189C, 16223T, 16230G, 16243C,
73G, 146C, 150T, 195C, 247A,
16256T, 16274A, 16278T, 16290T, 16300G,
316A
16311C, 16519C
L0f1
9a
1
16129A, 16169T, 16172C, 16174T, 16182C,
93G, 151T, 152C, 189G, 207A,
16183C, 16189C, 16223T, 16230G, 16278T,
247A, 263G
16311C, 16327T, 16368C, 16519C
L1c1d
10a
1
16038G, 16187T, 16189C, 16223T, 16278T,
73G, 151T, 152C, 182T, 186A,
16293G, 16294T, 16311C, 16360T, 16519C
189C, 195C, 198T, 247A, 263G,
297G, 316A
L1c3
11a
1
16129A, 16182C, 16183C, 16189C, 16215G,
73G, 152C, 182T, 186A, 189C,
16223T, 16278T, 16294T, 16311C, 16360T,
247A, 263G, 316A
16519C
137
�11b
1
16129A, 16183C, 16189C, 16209C, 16215G,
73G, 150T, 189G, 263G
16223T, 16278T, 16294T, 16311C, 16360T,
16519C
L2a1a
12a
12b
1
3
16092C, 16223T, 16278T, 16286T, 16294T,
73G, 146C, 152C, 195C, 198T,
16309G, 16390A, 16519C
247A
16092C, 16223T, 16278T, 16286T, 16294T,
73G, 146C, 152C, 195C, 263G
16309G, 16390A, 16519C
12c
1
16092C, 16223T, 16278T, 16286T, 16294T,
73G, 150T, 189G, 200G, 263G
16309G, 16390A, 16519C
12d
12e
1
1
16223T, 16278T, 16286T, 16294T, 16309G,
73G, 146C, 152C, 195C, 198T,
16390A, 16519C
247A
16223T, 16278T, 16286T, 16294T, 16309G,
73G, 146C, 152C, 195C, 263G
16390A, 16519C
L2a1b
13a
1
16051G, 16182C, 16183C, 16189C, 16192T,
73G, 146C, 152C, 195C, 263G
16223T, 16278T, 16290T, 16294T, 16309G,
16390A
13b
1
16051G, 16182C, 16183C, 16189C, 16223T,
73G, 146C, 152C, 195C, 263G
16278T, 16290T, 16294T, 16309G, 16390A
13c
1
16182C, 16183C, 16189C, 16194C, 16195A,
73G, 146C, 152C, 195C, 263G
16223T, 16278T, 16290T, 16294T, 16309G,
16390A
13d
13e
1
1
16182C, 16183C, 16189C, 16223T, 16278T,
73G, 146C, 150T, 152C, 182T,
16290T, 16294T, 16309G, 16380T, 16390A
183G, 195C, 198T, 263G, 325T
16182C, 16183C, 16189C, 16223T, 16278T,
73G, 146C, 152C, 195C, 263G
16290T, 16294T, 16309G, 16380T, 16390A
13f
4
16182C, 16183C, 16189C, 16223T, 16278T,
73G, 146C, 152C, 195C, 263G
16290T, 16294T, 16309G, 16390A
13g
13h
13i
1
1
1
16182C, 16183C, 16189C, 16223T, 16278T,
73G, 150T, 152C, 185A, 189G,
16290T, 16294T, 16309G, 16390A
263G
16182C, 16183C, 16189C, 16223T, 16278T,
73G, 150T, 185A, 189G, 195C,
16290T, 16294T, 16309G, 16390A
263G
16182C, 16183C, 16189C, 16223T, 16278T,
73G, 150T, 185A, 189G, 263G
16290T, 16294T, 16309G, 16390A
13j
1
16182C, 16183C, 16189C, 16223T, 16278T,
73G, 93G, 146C, 152C, 195C,
16290T, 16294T, 16309G, 16390A
236C, 247A, 263G
138
�13j
13k
1
1
16182C, 16183C, 16189C, 16223T, 16278T,
73G, 93G, 146C, 152C, 195C,
16290T, 16294T, 16309G, 16390A
263G
16182C, 16183C, 16189C, 16223T, 16278T,
73G, 146C, 152C, 195C, 263G
16290T, 16294T, 16390A
13l
1
16189C, 16223T, 16278T, 16294T, 16309G,
73G, 146C, 152C, 195C, 263G
16390A, 16519C
13m 1
L2c2
14a
14b
1
1
16189C, 16223T, 16278T, 16294T, 16309G,
93G, 152C, 189G, 204C, 207A,
16390A, 16519C
236C, 247A, 263G
16223T, 16264T, 16265G, 16278T, 16311C,
73G, 146C, 150T, 152C, 182T,
16390A
183G, 195C, 198T, 263G, 325T
16223T, 16264T, 16265G, 16278T, 16311C,
73G, 150T, 195C, 263G
16390A
14c
1
16223T, 16264T, 16265G, 16278T, 16311C,
73G, 93G, 146C, 150T, 152C,
16390A
182T, 183G, 195C, 198T, 263G,
325T
14d
14e
1
1
16223T, 16264T, 16265G, 16278T, 16311C,
73G, 93G, 146C, 150T, 152C,
16390A
182T, 195C, 198T, 263G, 325T
16223T, 16264T, 16278T, 16311C, 16390A
73G, 93G, 146C, 150T, 152C,
182T, 183G, 195C, 198T, 263G,
325T
14f
1
16223T, 16264T, 16278T, 16390A
73G, 93G, 146C, 150T, 152C,
182T, 195C, 198T, 263G, 325T
L2d1
15a
15b
15c
4
1
1
16093C, 16223T, 16278T, 16294T, 16311C,
73G, 143A, 146C, 152C, 182T,
16390A, 16399G, 16519C
195C, 263G
16093C, 16223T, 16278T, 16294T, 16311C,
73G, 146C, 152C, 195C, 198T,
16390A, 16399G, 16519C
247A
16093C, 16223T, 16278T, 16294T, 16311C,
73G, 146C, 152C, 195C, 247A
16390A, 16399G, 16519C
15d
1
16093C, 16223T, 16278T, 16294T, 16311C,
73G, 146C, 152C, 195C, 263G
16390A, 16399G, 16519C
L3d1a
16a
1
16124C, 16223T, 16319A
73G, 146C, 152C, 195C, 198T,
247A
16b
2
16124C, 16223T, 16319A
73G, 146C, 152C, 195C, 263G
16c
1
16124C, 16223T, 16319A
73G, 146C, 195C, 247A, 294A
139
�16d
7
16124C, 16223T, 16319A
73G, 150T, 152C, 263G
16e
1
16124C, 16223T, 16319A
73G, 150T, 185A, 189G, 263G
16f
1
16124C, 16223T, 16319A
93G, 95C, 185A, 189G, 236C,
247A, 263G
L3d3
17a
1
16124C, 16183C, 16189C, 16223T, 16278T,
73G, 152C, 195C, 263G
16304C, 16311C
17b
1
16124C, 16183C, 16189C, 16223T, 16278T,
73G, 152C, 195C, 263G
16304C, 16311C, 16430C
17c
1
16124C, 16183C, 16189C, 16223T, 16278T,
93G, 146C, 150T, 185A, 189G,
16304C, 16311C, 16430C
195C, 204C, 207A, 236C, 247A,
263G
L3e1a1 18a
2
16185T, 16223T, 16265G, 16311C, 16327T,
73G, 150T, 189G, 200G, 263G
16519C
18b
1
16185T, 16223T, 16311C, 16327T
73G, 150T, 185A, 189G, 200G,
263G
L3e1b
18c
1
16185T, 16223T, 16311C, 16327T, 16519C
73G, 146C, 152C, 195C, 263G
18d
2
16185T, 16223T, 16311C, 16327T, 16519C
73G, 150T, 185A, 189G, 263G
18e
1
16185T, 16223T, 16311C, 16327T, 16519C
73G, 150T, 189G, 200G, 263G
18f
1
16185T, 16223T, 16311C, 16327T, 16519C
73G, 150T, 189G, 263G
19a
1
16223T, 16239T, 16325delT
73G, 146C, 152C, 195C, 198T,
247A
19b
1
16223T, 16239T, 16325delT
73G, 150T, 152C, 185A, 189G,
263G
19c
2
16223T, 16239T, 16325delT
73G, 150T, 185A, 189G, 195C,
263G
L3e2b
19d
5
16223T, 16239T, 16325delT
73G, 150T, 185A, 189G, 263G
19e
1
16223T, 16239T, 16325delT
73G, 150T, 195C, 263G
19f
2
16223T, 16239T, 16325delT, 16519C
73G, 150T, 185A, 189G, 263G
19g
3
16223T, 16325delT, 16327T
73G, 150T, 185A, 189G, 263G
20a
1
16070C, 16172C, 16183C, 16189C, 16223T,
73G, 150T, 195C, 263G
16320T, 16519C
140
�20b
1
16172C, 16182C, 16183C, 16189C, 16223T,
73G, 150T, 195C, 263G
16320T, 16519C
20c
20d
1
12
16172C, 16183C, 16189C, 16223T, 16320T,
73G, 146C, 152C, 195C, 244G,
16519C
263G, 340T
16172C, 16183C, 16189C, 16223T, 16320T,
73G, 150T, 152C, 263G
16519C
20e
20f
1
1
16172C, 16183C, 16189C, 16223T, 16320T,
73G, 152C, 182T, 186A, 189C,
16519C
247A, 263G, 316A
16172C, 16183C, 16189C, 16223T, 16320T,
73G, 95C, 189G, 198T, 247A, 263G
16519C
L3e3
21a
1
16223T, 16265T, 16519C
73G, 150T, 195C, 263G
L4b2
22a
1
16051G, 16114T, 16189C, 16207G, 16223T,
73G, 146C, 152C, 195C, 244G,
16293T, 16311C, 16316G, 16355T, 16362C,
263G
16399G, 16519C
141
�Appendix E: Comparative data sources
Table S3
142
�Comparative data from In-house (HGDDRU)
projects
Table S3 continued
143
�Appendix F: Preparation of Solutions
70% Ethanol Solution
96% Ethanol Solution 729ml
*Make up to 1000ml with ddH2O
0.5M Ethylenediamine Tetra-acetic Acid (EDTA)
Na2EDTA.2H2O
93.05g
dH2O
300ml
Final volume (dH2O) 500ml
* pH adjusted to 8.0 with 10M NaOH and then autoclaved
1 X TE buffer
10 ml 1 M Tris-HCl pH8
2 ml 0.5 M EDTA
Make up to 1000ml with dH2O and autoclave
10 X TBE buffer
108 g Tris
55 g Boric acid
7.44 g EDTA
Make up to 1000ml with dH2O and autoclave
1 X TBE (1:10 dilution)
40 ml 10 X TBE
Make up to 200ml with ddH20
10M NaOH
NaOH pellets
4g
dH2O
10ml
2% Agarose Gel
Agarose
0.5g
144
�1 x TBE
50ml
EtBr
0.5µl
Ficoll loading Dye
Sucrose
50%
EDTA
50mM
Bromophenol blue 0.10%
Ficoll
10%
1 M Tris-HCl
121.1 g Tris
1 L dH2O
Autoclave
1 M MgCl2
101.66 g MgCl2
500 ml dH2O
Autoclave
Proteinase K (10 mg/ml)
100 mg Proteinase K stock (100 mg/ml)*
10 ml ddH20
*Available from Roche Diagnostics
Proteinase-K mix
For 16 extractions:
400µl 10% SDS
16µl 0.5 M EDTA
2.8 ml autoclaved dH2O
Add 800 µl Proteinase K (10 mg/ml stock) just before use
Saturated NaCl
100 ml autoclaved dH2O
Slowly add 40 g NaCl until absolutely saturated (some NaCl will precipitate out)
Before use, agitate and let NaCl precipitate out
145
�Bromophenol blue Ficoll dye
50 ml dH2O
50 g sucrose
1.86 g EDTA
0.1 g bromophenol blue
145
10 g Ficoll
Dissolve
Adjust volume to 100 ml with dH2O, stir overnight
pH to 8.0
Filter through Whatmann filter paper
Store at room temperature
10 mg/ml Ethidium bromide (EtBr)
Add 1 g of ethidium bromide to
100 ml of ddH2O
Stir until completely dissolved
Store at 4°C wrapped in aluminum foil
1kb size standard
285 µl 1kb ladder (GibcoBRL)
143 µl Ficoll dye
2400 µl 1 X TE
146
�
 David de Veredicis


![relationship with the modal haplotype Riai1a_2 are shown in Figure 3.2 below. Acknowledging that matches to haplotypes are only as good as the data within datasets and not representative of all Y chromosomes haplotypes found globally, these data do support a non-African origin of Y chromosome haplotypes in the amaMolo. Two distinct Eurasian haplogroups, namely haplogroup Riata (R-M198) and haplogroup Q (Q-M242), were observed within the amaMolo clan genealogy which spans 11 generations [Table 3.2(a) and Appendix C, (Figure S1)]. Five haplotypes are associated with haplogroup R1ata (R-M198) (Table 3.2(a)) and their relationship with the modal haplotype Riai1a_2 are shown in Figure 3.2 below.](https://figures.academia-assets.com/107292078/figure_015.jpg)