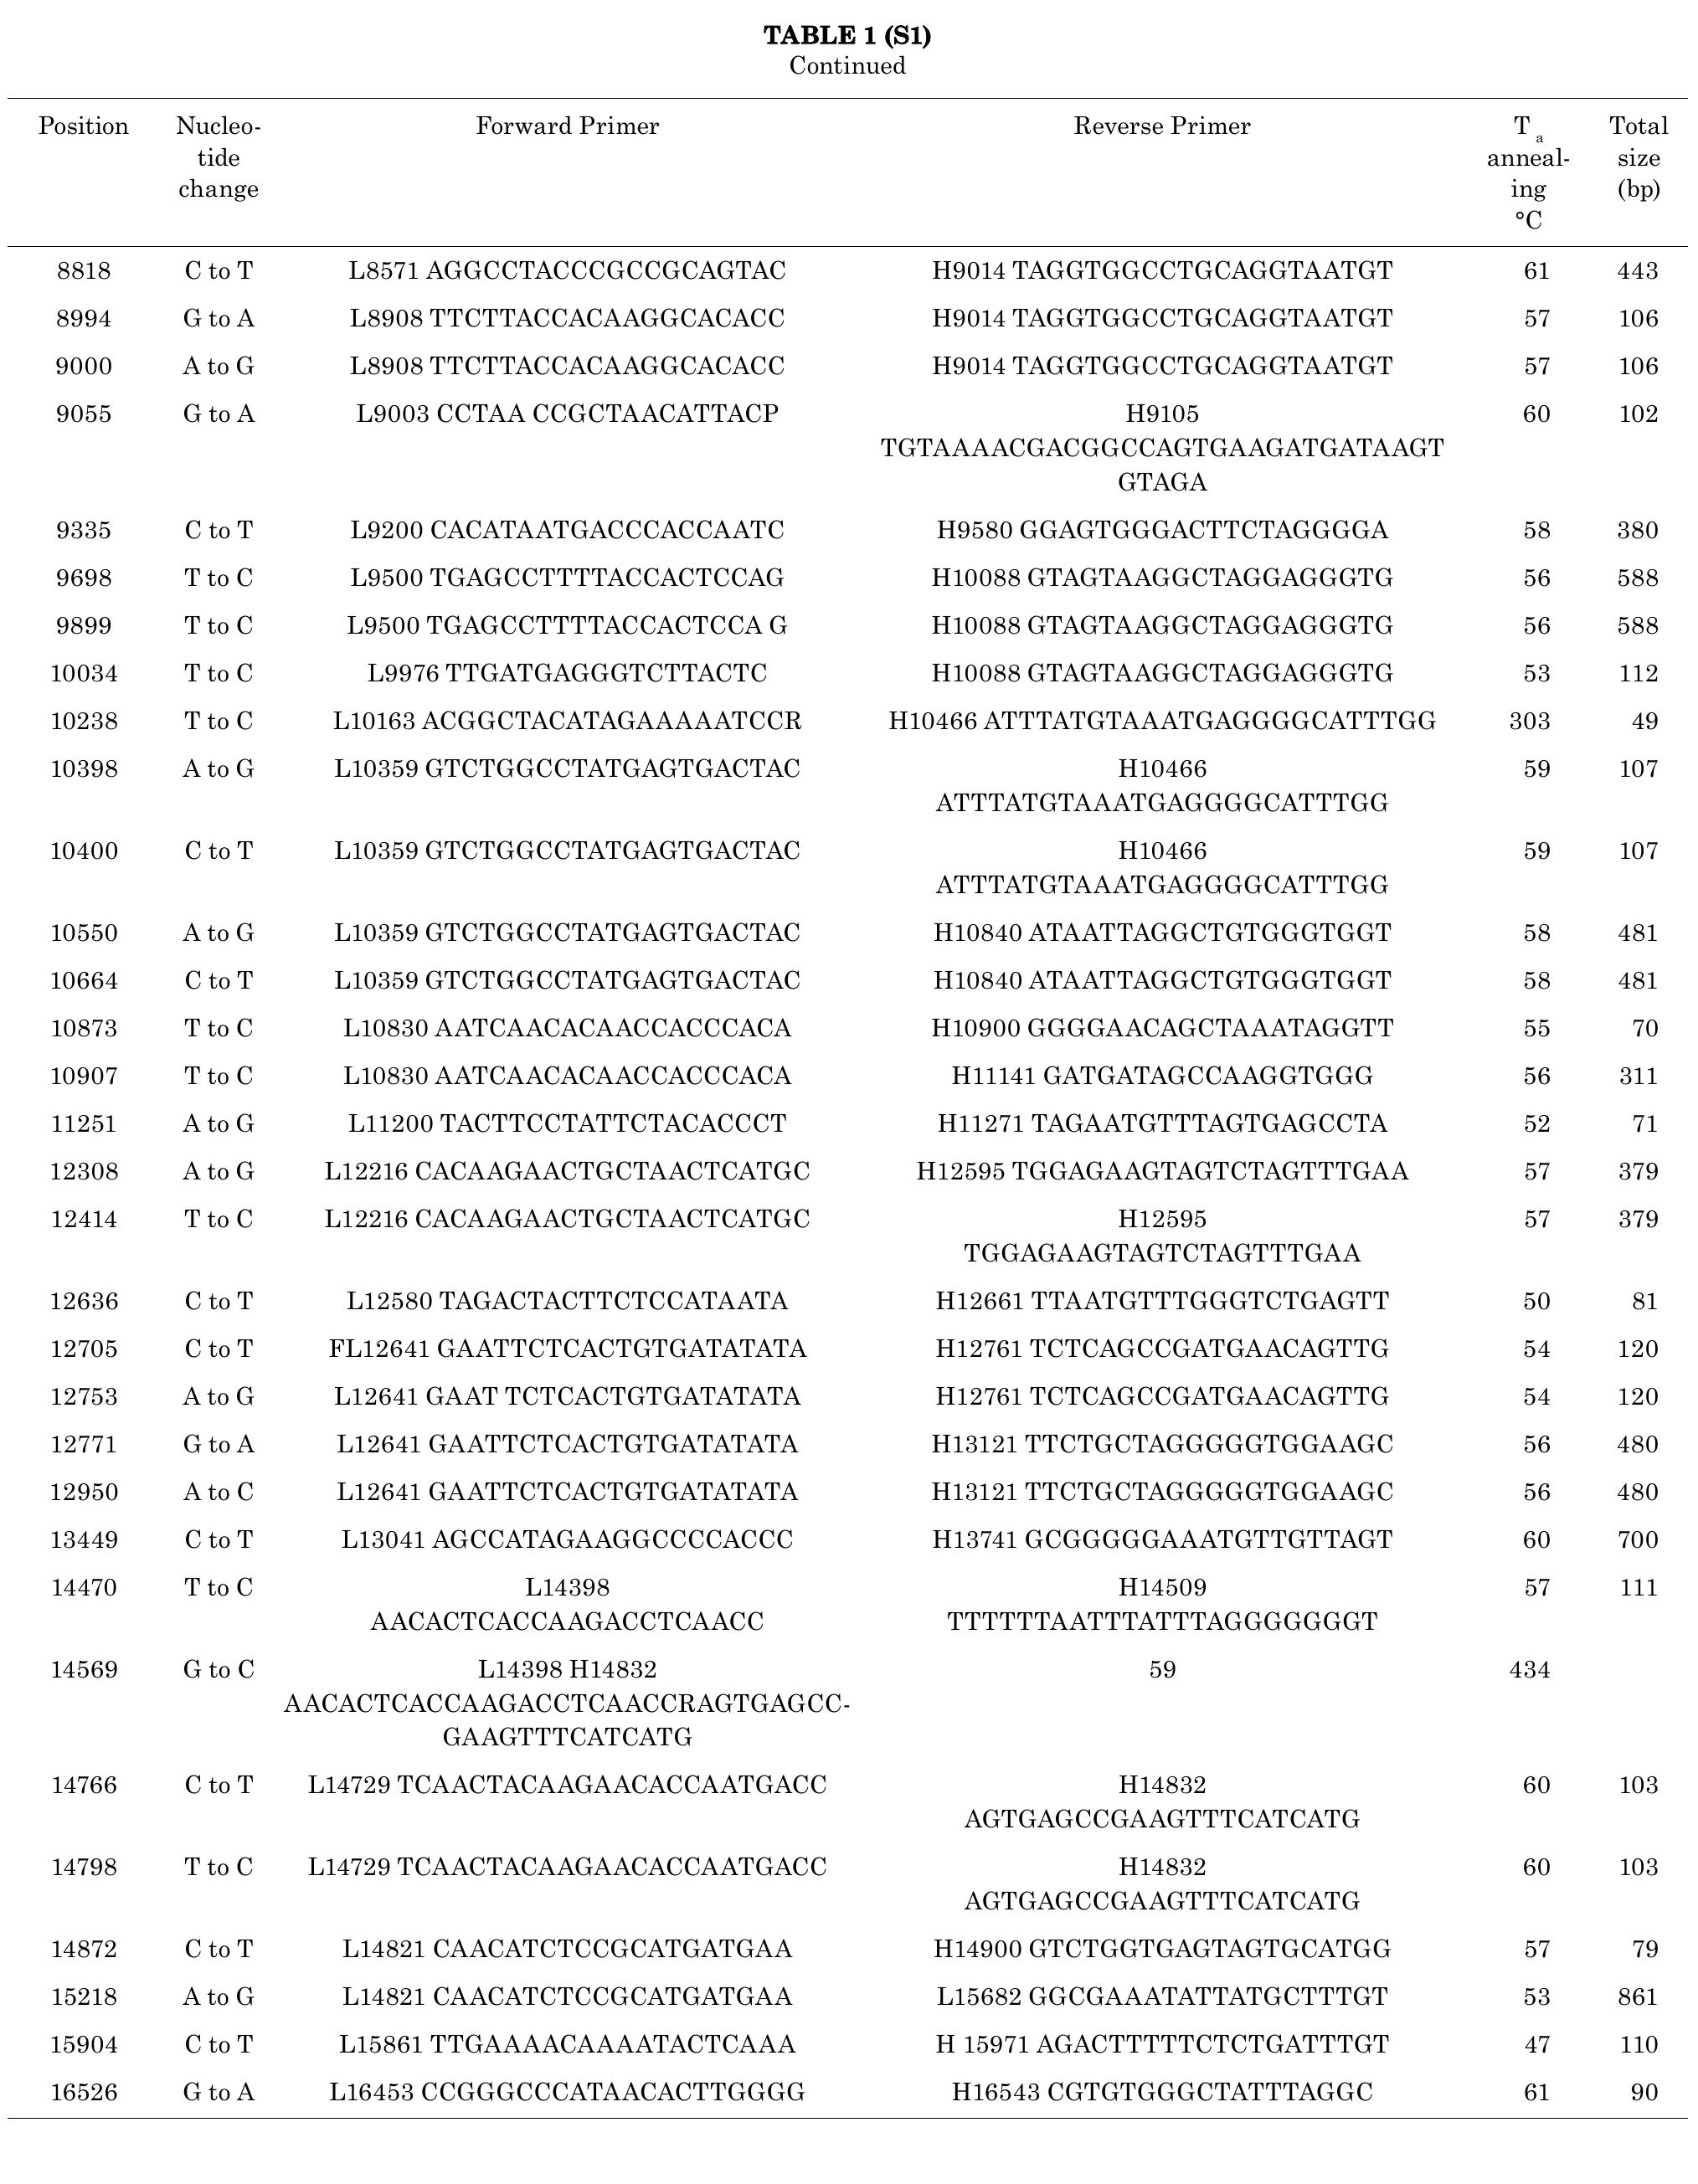
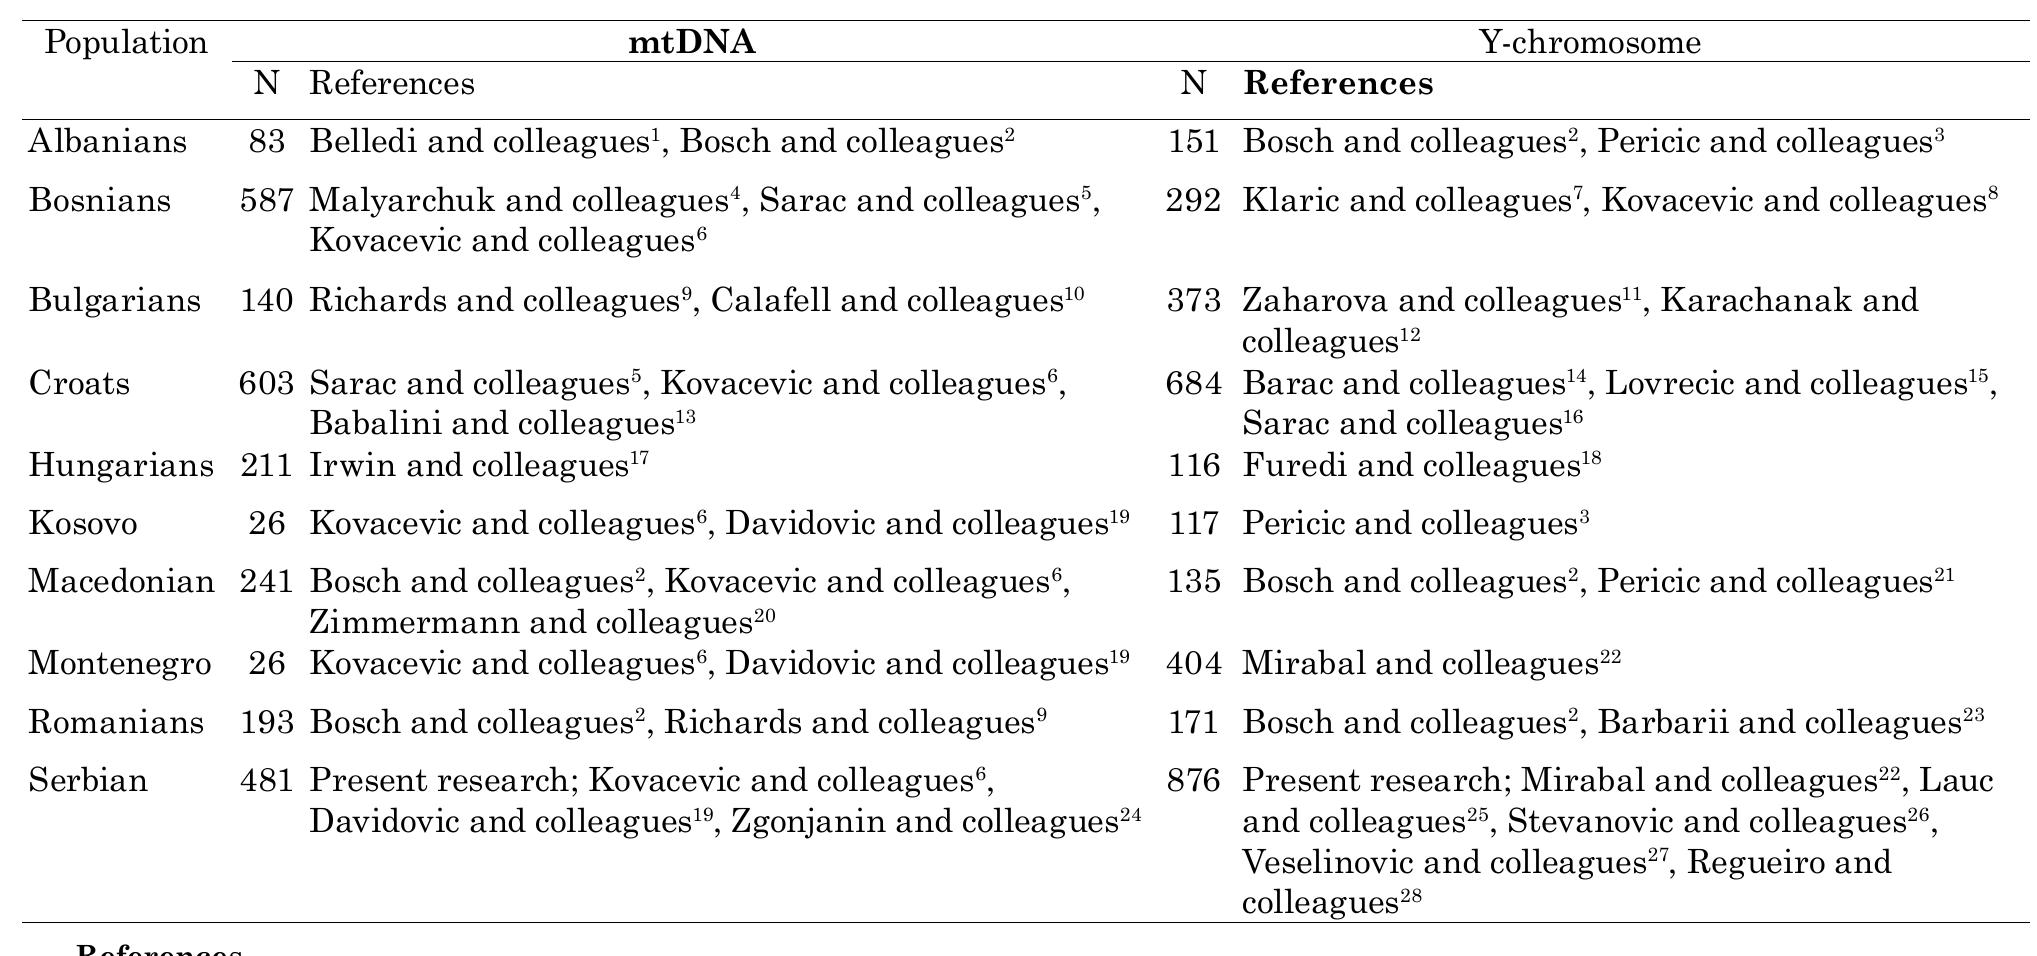
Fig. 1: Geographical ___location of the Serbian samples. G. Scorrano et al.: Stable isotopes and breastfeeding practices in Neolithic, Coll. Antropol. 41 (2017) 3: 275-296 Fig. 2 Non Metric Multidimensional Scaling (nmMDS) analysis from distance matrices among haplotypes of the different Serbian regions and neighboring populations: a) FST genetic distances for mtDNA, b) Rst genetic distance for the Y-chromosome. G. Scorrano et al.: Stable isotopes and breastfeeding practices in Neolithic, Coll. Antropol. 41 (2017) 3: 275-296 POPULATIONS, REFERENCES AND NUMBER OF SAMPLES OF MTDNA AND THE Y-CHROMOSOMES USED FOR THE COMPARISONS SNPS IN THE NON-RECOMBINING REGION OF THE Y CHROMOSOME GENOTYPED AND PRIMERS (5’ TO 3’ USED IN AMPLIFICATION. TABLE 3 (S3) The two most frequent sub-clades of R1 in Europe are Rla, found in the North-East, and R1b, found in the West. This geographic distribution could reflect episodic popula- tion expansions during the post-glacial period, including those associated with the spread of agricultural/pastoral culture.**-*? The frequency of R1b in Serbians (6%) is low- er than what is present in other southeastern European populations but it is consistent with the frequency report- ed for another Serbian sample*’. Even for the Y chromo- some nmMDS was generated considering the STR haplo- types of four split Serbian regions and neighboring populations. Studenica and Sumadija mtDNA haplotypes were pooled to other data from the Central regions*”°**° because no significant differences were found among them (p>0.05 for each pair of groups). To what concerns South- ern Serbian region, Brestovac and Nish results are used for the analysis. For Serbians from the West*® and the Vojvodina province*’ published data were used for com- parison while for the East it was not possible to use pub- ished data. The Ychromosome nmMDS plot was first generated considering the same populations used for mtD- A analysis (Figure $1). In this case, the Hungarian population appeared apart while all the other populations clustered together. At a later step, the RST matrix and nmMDS were reconstructed, excluding this population from the analysis. TABLE 2 ere Y-CHROMOSOME HAPLOGROUPS FREQUENCIES IN THE SERBIAN POPULATION ANALYSED. mtDNA HAPLOTYPES, NUMBER OF INDIVIDUALS (N); HAPLOGROUBS; HVS-I, HVS-II, AND MTDNA CODING REGION SNPS OF THE DIFFERENT SERBIAN SAMPLES. TABLE 5 (S5)