Mhlabunzima Mxhaka, by Janet Kalis, as part of her research (Kalis, 2009; personal communication). Two -igure 1.4. Schematic overview of the mitochondrial DNA molecule. HVRI & HVRII as situated in mitochondrial coding genes. Numbers indicate positions of DNA base pairs. Adapted from the 1.3.2 mtDNA phylogeographic variation and inferring matrilines ‘igure 2.3. Research area of the study. Depicted are the locations of /alis, or homesteads of the three rimary abeLungu clans, namely abeLungu Jekwa, Buku, Hatu as well as the amaMolo. The research rea is located between the Xhora and Mzimvubu rivers, as situated along the Wild Coast, in the ‘astern Cape of South Africa. This distribution can be found under Table 1. This map has been adaptec ‘om Google Maps online service: Imagery @2013 TerraMetrics, Map data @2013 AfriGis (Pty) Ltd. j00gle Maps Eastern Cape of South Africa. This distribution can be found under Table 1. This map has been adaptex Figure 2.4 (a) The Y chromosome SNP phylogeny with topology adapted from Karafet et al., (2008) and nomenclature based on the ISOGG Y-DNA Haplogroup Tree (2016), illustrating the Y haplogroups which are designated by specife SNP markers screened for using the SNaPshot™ SBE method, as well as the multiplex Il assay. Newer branches of haplogroup A (AO and AOO), more recently defined by ISOGG (2015) have not been indicated on the phylogeny (b) An electropherogram showing the relative peak height, position and colour of peaks illustrating the derived states of the Y-STR markers screened for when using the YSNP1 SBE marker panel 22 and nomenclature based on the ISOGG Y-DNA Haplogroup Tree (2016), illustrating the Y haplogroups with modifications on methods established by Naidoo et al., (2010). PCRs were conducted using GeneAmp® PCR System 9700 Thermal Cyclers (Life Technologies). Table 2.3. YSNP1 SBE multiplex PCR reagents Table 2.4. SBE PCR thermal cycler conditions Table 2.6. YSNP1 Multiplex SBE reaction Table 2.7. Primer sequences for the mtDNA1kb D-loop PCR amplification relationship with the modal haplotype Riai1a_2 are shown in Figure 3.2 below. Acknowledging that matches to haplotypes are only as good as the data within datasets and not representative of all Y chromosomes haplotypes found globally, these data do support a non-African origin of Y chromosome haplotypes in the amaMolo. Two distinct Eurasian haplogroups, namely haplogroup Riata (R-M198) and haplogroup Q (Q-M242), were observed within the amaMolo clan genealogy which spans 11 generations [Table 3.2(a) and Appendix C, (Figure S1)]. Five haplotypes are associated with haplogroup R1ata (R-M198) (Table 3.2(a)) and their relationship with the modal haplotype Riai1a_2 are shown in Figure 3.2 below. Table 3.3: Haplotypes and presumed geographic origin of abeLungu clan male founders Figure 3.9. Distribution of mtDNA haplogroups by clan abeLungu Jekwa mtDNA haplogroups abeLungu Hatu mtDNA haplogroups abeLungu Buku mtDNA haplogroups Figure 3.9 continued. Distribution of mtDNA haplogroups by clan non-clan affiliated samples mtDNA haplogroups Table S1 Table S1 continued Table S2 Appendix E: Comparative data sources Table S3


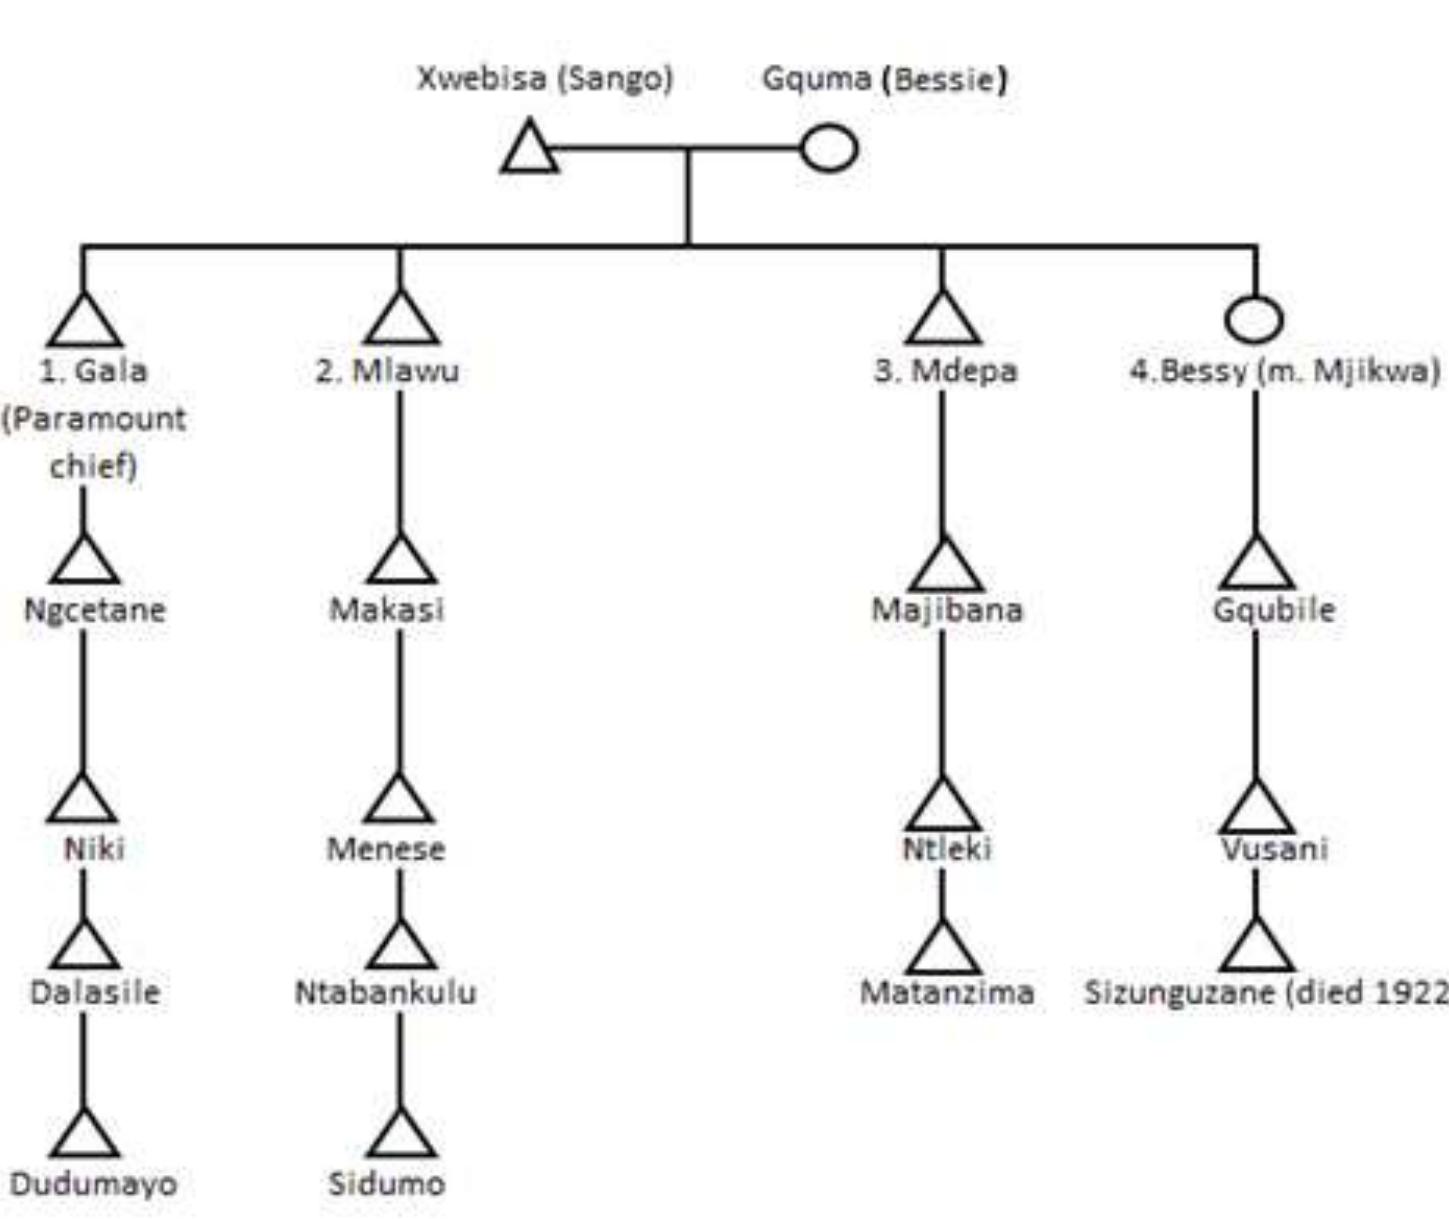
![relationship with the modal haplotype Riai1a_2 are shown in Figure 3.2 below. Acknowledging that matches to haplotypes are only as good as the data within datasets and not representative of all Y chromosomes haplotypes found globally, these data do support a non-African origin of Y chromosome haplotypes in the amaMolo. Two distinct Eurasian haplogroups, namely haplogroup Riata (R-M198) and haplogroup Q (Q-M242), were observed within the amaMolo clan genealogy which spans 11 generations [Table 3.2(a) and Appendix C, (Figure S1)]. Five haplotypes are associated with haplogroup R1ata (R-M198) (Table 3.2(a)) and their relationship with the modal haplotype Riai1a_2 are shown in Figure 3.2 below.](https://figures.academia-assets.com/107292078/figure_015.jpg)