NStars 1: Photometric surveys --- | ---
NStars 2: proper motion stars
NStars 1: Photometric surveys --- | ---
NStars 2: proper motion stars
 NStars 1: Photometric surveys --- | ---
NStars 2: proper motion stars
NStars 1: Photometric surveys --- | ---
NStars 2: proper motion stars


Photometric searches (II): 2MASS near-infrared data and optical counterparts
2. The 'Moving' M-dwarf sample: Optical Non-detections and Near-infrared Photometric
Selection
The nearby star sample identified using the criteria outlined in section 1 should include a substantial number of interesting objects, and provide the first large-scale survey of early-type L dwarfs in the Solar neighbourhood - but that sample selects only the latest-type M dwarfs. The degeneracy in the (J-K) colour means that we cannot use JHK photometry in isolation to extend that sample to extend coverage to earlier spectral types. Ideally, we would use optical/near-infrared colours to select the candidate Solar Neighbourhood objects (as illustrated in Figure 1.12 for (MJ, (I-J))). However, while the 2MASS catalogue does list optical magnitudes (B, R) for point sources, there are complications in using those data.
The source of the optical photometry in the 2MASS catalogue is the USNOA catalogue, which is based on scans of the POSS I O and E plates in the northern hemisphere, and of the UK Schmidt J and ESO Schmidt R platesin the southern hemisphere. The catalogue only includes sources detected on both plates - so faint red sources, such as late-type dwarfs, which are not detected on the blue plates are not included in the catalogue. The cross-referencing is based solely on position: the catalogue lists data for the nearest USNO source, with a maximum search radius of 6 arcseconds. The average epoch of the POSS I data is 1954; the average epoch of the UKST/ESO data is ~1980; the average epoch of the 2MASS data is ~1999. Since the majority of nearby stars can be expected to have significant proper motions, a substantial fraction of these objects moved more than 6 arcseconds in the 20 to 44 years between the photographic and near-infrared imaging - particularly for the northern hemisphere (POSS I) matching. In that case, 2MASS either fails to find an appropriate match, or, in crowded fields, might even matches against the wrong optical source. Given the surface density of stars as a function of apparent magnitude, the latter is unlikely to be a major problem (we return to this in the following section); however, absence of optical data certainly is an issue. More recent photographic surveys are in existence - POSS II in the north (J, F and N plates; average epoch ~1991; UKST R-band data in the south, average epoch ~1995) - and scans of those plates exist at several locations (notably USNO an STScI). However, cross-referencing the entire 2MASS catalogue against those catalogues is beyond the scope of the current project. We therefore adopt a different strategy.
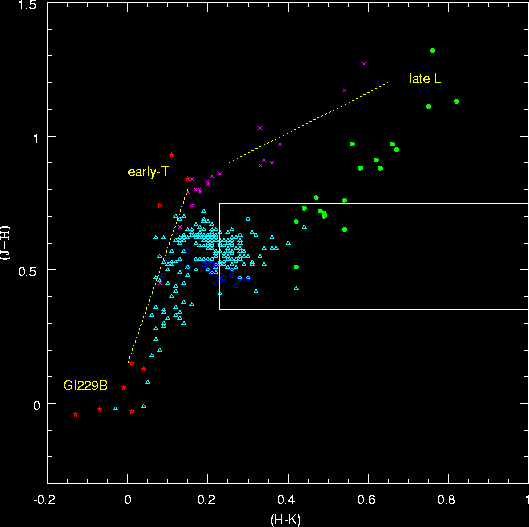
Figure 1.25: Colour selection criteria for late-type dwarfs in the (J-H)/(H-K) two-colour diagram. The symbols have the same meaning as in Figure 1.22, and the box outlines the colour selection criteria. |
1. Identify late-type dwarfs based on the (J-H)/(H-K) colours: While (J-K) is not a good photometric parallax indicator for these dwarfs, we can isolate the salient region of the dwarfs sequence in the two-colour JHK plane. Figure 1.25 shows our selection criteria
2. Use non-detection in the USNOA catalogue to identify proper motion stars: The colour/colour criteria outlined in Figure 1.25 overlap to some extent with the colours of both distant, reddened early-type stars and red giants. However, we can turn the limitations of the 2MASS optical matching to our advantage and eliminate those sources. As noted above, a substantial fraction of the nearby star population should have moved more than the 6 arcsecond 2MASS/USNO search radius in the time between the taking of the optical plates and the 2MASS imaging; however, higher luminosity, more distant sources, such as red giants and reddened main-sequence stars, have low proper motions, and should therefore have optical matches. We therefore include in this sample only 2MASS sources with 'null' R magnitudes. (Low proper-motion nearby stars will also be eliminated by applying this criterion; we deal with those stars in the following section.)
Figure 1.26: The (J, (J-K)) colour-magnitude distribution for nearby stars and brown dwarfs at 20 parsecs. The green points identify stars which meet the (J-H)/(H-K) colour criteria outlined in Figure 1.25; the horizontal line marks the magnitude selection limit. |
3. Eliminate all JHK-selected dwarfs with J > 12.5: JHK colour selection alone is not sufficient to hone down the sample to a manageable size; M3 dwarfs, MJ ~ 7.5, satisfy the colour criteria, so our colour-selected sample could extend to distances of 500 parsecs for those sources (Jlim ~ 16). We can limit contamination from more distant sources by setting an apparent magnitude limit corresponding to the intrinsically faintest M dwarfs targeted here. We noted in section 1 that VB 10 easily meets the colour/magnitude criteria for the ultracool dwarf sample; VB 8 does not. VB 10 has MJ=11.05, so J=12.55 at 20 parsecs; we therefore set a limit of J < 12.5. Thus, our `moving' M dwarf sample should nicely complement the photometrically-selected ultracool sample.
Figure 1.27: Selection limits in the (R, (R-K)) plane. As in Figure 1.21 and Figure 1.26, the points show data for nearby stars and brown dwarfs at a distance of 20 parsecs; the solid line marks the colour/magnitude limits described in the text. Neraby star candidates should lie above that line. |
4. Use (R-K) colours to eliminate dwarfs beyond 20 pc: Even with a magnitude limit of J < 12.5, the `moving' M dwarf sample will still include M3 dwarfs at distances of 100 parsecs. However, the sample has now been reduced to a manageable size - a few x 104 sources - and we can cross-reference those data, star by star, against the scond-epoch photpgraphic catalogues. The time difference between 2MASS and those surveys is sufficiently small that we can match against the nearest source with a small search radius, 6 arcseconds, and determine (R-K) colours. Plotting the (R, (R-K)) diagram, we eliminate sources with
Figure 1.28: JHK colour/colour diagram for stars selected based on criteria 1 to 3. |
We have applied these criteria - at least, the first three - to 2MASS data for ~30% of the sky, extracting a sample of ~10,000 stars. Figure 1.28 plots the resulting colour/colour diagram. The majority of the sample have colours consistent with those expected for late-type dwarfs, but there is a scattering of points at much redder (H-K) colours, and an obvious grouping of stars in the top-left corner (i.e. relatively blue (H-K), red (J-H)). The latter are likely to be red giants lacking optical data - possibly because the stars are too bright to allow reliable positional/magnitude measurements from the POSS I/UKST/ESO Schmidt plates.
Figure 1.29: JHK colour/colour diagram for the NLTT stars in the `moving' M dwarf sample |
We still have to cross-reference this sample against the more recent photographic sky surveys, but we can gain some insight into the sample through several other techniques. First, a small subset of the stars lie within a high-declination region used by USNO to test plate-matching techniques for the compilation of the USNO2 proper-motion catalogue; the overwhelming majority of the 179 targets are confirmed as real proper motion objects. Second, we can cross-reference this sample against the NLTT: setting a match radius of 10 arcseconds, 3331 of the 10145 2MASS sources are likely to be NLTT stars; increasing the match radius to 15 arcseconds gives only a marginal increase in the pairing - 3437 source are identified as likely NLTT stars. Figure 1.29 shows the colour-colour diagram for those stars: the giant sequence disappears, and there are few sources with (H-K) > 0.45. (The nearby stars amongst the NLTT sample should be identified in our NLTT search. )
Figure 1.30: The (RA, Dec) distribution (in Sanson-Flamsteed projection, centred on 12 hours) of the matched-NLTT stars and the unmatched stars from our first cut at the `moving' M dwarf sample. Note the ___location of the Galactic Plane avoidance zone. |
Figure 1.30 plots the (RA, Dec) distribution of the NLTT-matched and unmatched samples used to derive figures 1.28 and 1.29; note the Galactic Plane running through the dataset at 17-20 hours. A couple of systematic effects are evident in this figure. First, there are no 2MASS/NLTT matches below dec=-50o. The NLTT stars in this region of the sky are from the Bruce Proper Motion survey, and the failure to match any of the 2MASS sources probably represents a combination of the bright limiting magnitude of that survey (mpg ~ 15.5) and, perhaps, lower accuracy NLTT positions. The second effect is apparent near the Galactic Plane: the matched sources show a clear decrease in numbers as one approaches the avoidance zone; that is, the number of NLTT stars decreases with decreasing latitude. This behaviour is opposite to the expected trend: while we don't expect as sharp an increase towards the Plane in proper-motion star counts as in general starcounts (since the proper motion stars lie closer to the sun, where density variations are less pronounced), some increase is expected. The observed decrease probably reflects incompleteness in the NLTT catalogue; this is not unexpected, since detecting proper motion stars simply becomes more difficult in high star density regions, where there is a higher chance of confusion, for either visual or machine scans.
Overall, these tests suggest that, once
we add the photographic R magnitudes, the
search criteria we have adopted will provide an effective means of identifying mid- and late-type M dwarfs
within 20 parsecs of the Sun.
And adding F, B magnitudes from the GSC2.2 does, indeed, lead to a sample
of about 1100 candidate proper motion stars: 1/3rd prove to be junk, 1/2 are known, the remainder are new.
 NStars Photometric
surveys index
NStars Photometric
surveys index
NStars home page
INR home page