The table they pull that data from is annual and only has info through 2022[1]. It's not useful for saying anything about the year-over-year monthly number being discussed. The chart showing monthly sales of road petroleum show a consistent 5% annual drawdown, which is proportional to how quickly the fleet is transitioning[2].
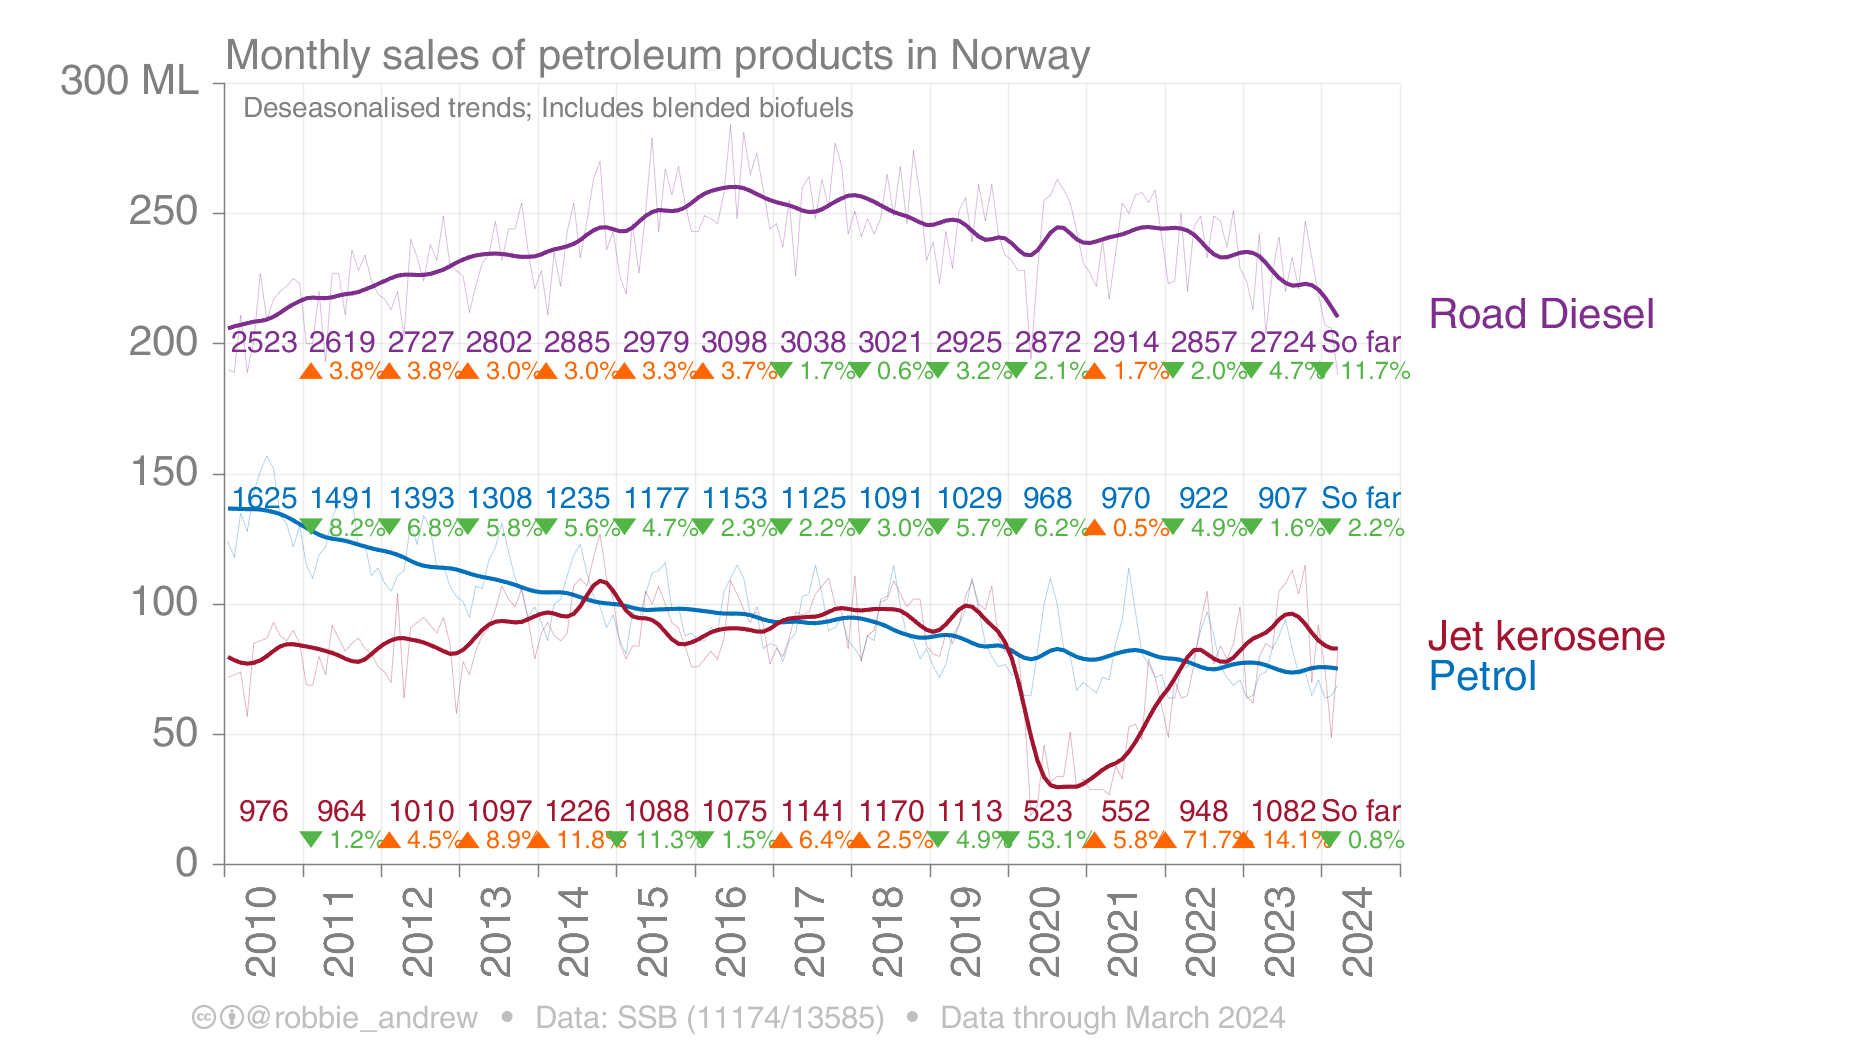
Here is a graph from the source used in TFA. Now look at the sum of gasoline, diesel and biofuels, and tell me that's "cratering".
https://robbieandrew.github.io/EV/img/NORenergy_road.png